Response Pane
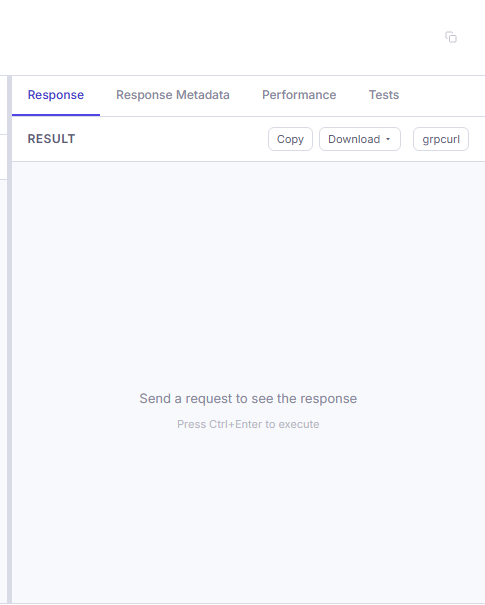
The response pane displays the result of a method invocation with syntax highlighting, status information, and action buttons.
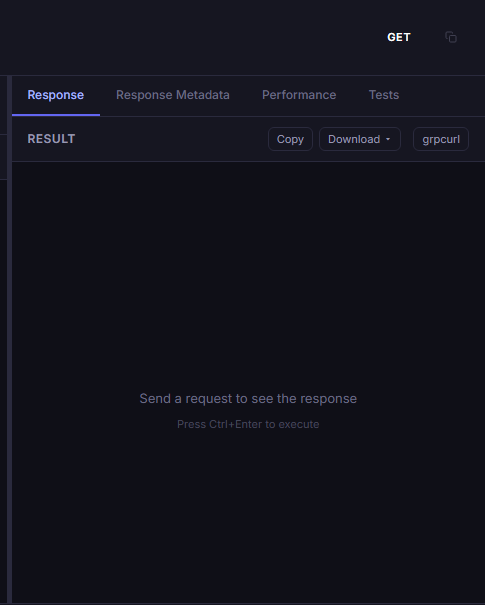
Unary Responses
For unary calls, the response pane shows:
- Status -- the gRPC status code or HTTP status (e.g., "OK", "NotFound")
- Duration -- how long the call took
- Response headers -- key-value pairs from the server
- Response body -- syntax-highlighted JSON
The response body is formatted with indentation for readability.
Streaming Responses
For server-streaming calls, messages appear one at a time as they arrive:
- Each message is appended to the response viewer with a timestamp
- A streaming indicator shows the connection is active
- A message counter tracks how many messages have been received
- Click Stop to cancel the stream
For duplex channels, the response pane shows received messages while the request pane remains available for sending.
Syntax Highlighting
JSON responses are syntax-highlighted with colors for strings, numbers, booleans, and null values. The highlighting works in both dark and light themes.
Actions
Every action in this cluster except Use this... is an icon button. The cluster is the densest row in the workbench, and labels there restated glyphs that are understood without them -- copy, download, expand and collapse. The label is not gone, it moved: hover shows it as a tooltip, and each button carries the same text as its accessible name. Use this... keeps its label because it is the one primary action in the cluster.
Copy
Click the copy icon to copy the response body to your clipboard. For streaming responses, this copies all messages received so far.
Download
Click the download icon to save the response as a JSON file; the caret next to it picks the format. For streaming responses, all received messages are saved as a JSON array.
Expand / collapse
The two chevron buttons open and close every node of the JSON tree at once. They are hidden while a stream is running -- the streaming pane has its own controls.
Copy as code
The copy button is a split button. The primary half copies the response body; the caret opens a protocol-aware code-export list -- REST offers curl / fetch / Python, gRPC offers grpcurl, WebSocket offers wscat, and so on. The old standalone Export as grpcurl button was folded into this dropdown, so the offered commands always match the protocol of the method you are looking at.
Every protocol's list ends with Copy as Bowire CLI, which renders the request as a runnable bowire call ... line rather than translating it into another tool. It is an entry in this dropdown rather than a button of its own -- the action cluster has exactly one primary button, and that one is Use this... below. MQTT, NATS and Socket.IO offer only this entry: they used to fall through to the REST list and be handed a curl command that could never reach a broker.
The command carries a # note block for anything the CLI cannot reproduce (runtime-fetched auth tokens, query-string API keys, duplex methods), and never resolves {{secret.*}} or {{keyring.*}} references into the copied text. The Code tab in the request pane offers the same entry plus a shell-flavour toggle and a Keep {{variables}} pill. See Export & Import and CLI mode.
Use this...
Once a call has succeeded, a Use this... button appears at the front of the action cluster. It answers the question the workbench used to leave hanging -- and now what? -- by turning the response you are looking at into the next artefact, without retyping the request anywhere:
| Item | What it does | Needs |
|---|---|---|
| Save as mock | Freezes the request + response into a recording step and, when a mock host is available, boots a mock server from it and opens the Mock servers view | Kuestenlogik.Bowire.Recordings to capture, Kuestenlogik.Bowire.Mock to boot |
| Add to flow... | Appends the request as a step in a new or existing flow, carrying a status == <this status> assertion |
Kuestenlogik.Bowire.Flows |
| Keep as test | Saves the status (and the response body, when there is one) as assertions for this service and method, then switches to the Test results tab | nothing -- assertions are core |
| Add to benchmark envelope... | Adds the request to a new or existing benchmark envelope | Kuestenlogik.Bowire.Benchmarking |
Items whose package is not installed stay visible but disabled, with a tooltip naming the package they need. A workbench running on Kuestenlogik.Bowire.Bundle.Minimal therefore still shows the full menu and tells you what is missing, instead of quietly offering a shorter one.
The button appears on both response surfaces -- the schema-driven Discover response pane and the Compose request builder's response viewer -- and both open the same menu. Two details differ on the Compose side, because that surface has no RPC identity of its own:
- Keep as test keys the assertions on the request URL's host and path (or on the discovered method, if the tab was created from one) instead of a service name, and toasts where the results will show up: the Compose viewer's own Tests tab is a pre/post-script placeholder, not an assertion-results surface.
- Save as mock derives the mock's HTTP path from the request URL, since the method field there holds a bare verb.
Everything the menu hands off is re-read at click time, so switching methods before choosing an item never hands off the previous method's request.
See also: Mock server, Flows, Test assertions, Performance & benchmarks, Recording & replay
Error Display
When a call fails, the response pane shows:
- Error status -- the gRPC status code name (e.g., "NotFound", "Internal")
- Error detail -- the server's error message
- Duration -- how long before the error occurred
See also: Streaming, Export & Import