Features
Simplicity is tied in.
All in one workbench — no tool switch required.
Each section below links to the technical documentation for the full details.
Discover and invoke
Plug a protocol in, get a live service tree. Compose requests with typed forms or raw JSON. Every call pattern — unary, streaming, duplex, REST verbs, GraphQL, MQTT publishes — ends up in the same UI.
Auto-discovery with hot reload
Plug in a protocol, get a service tree — no hand-maintained proto / OpenAPI / hub-registration code.
Each protocol plugin implements a single DiscoverAsync method: gRPC hits Server Reflection, REST reads the OpenAPI spec, SignalR enumerates mapped hubs via EndpointDataSource, GraphQL introspects __schema, MQTT subscribes to $SYS/#, and so on. Bowire merges the results into a single sidebar across every installed plugin.
For event-driven APIs that come with their own contract, point Bowire at an asyncapi.yaml / .json document (2.x + 3.0). The AsyncAPI plugin parses channels + operations + bindings, then routes invocations through whichever wire plugin the doc declares — today http (no broker needed), mqtt / mqtt5, kafka, ws, and amqp / amqp1. NATS lands alongside the matching wire plugin.
The discovery pass repeats every few seconds against every configured URL. A new method registered on a running server shows up in the sidebar within the next tick — no page refresh, no re-upload, no “disconnect and retry” dance.
Read the technical docs →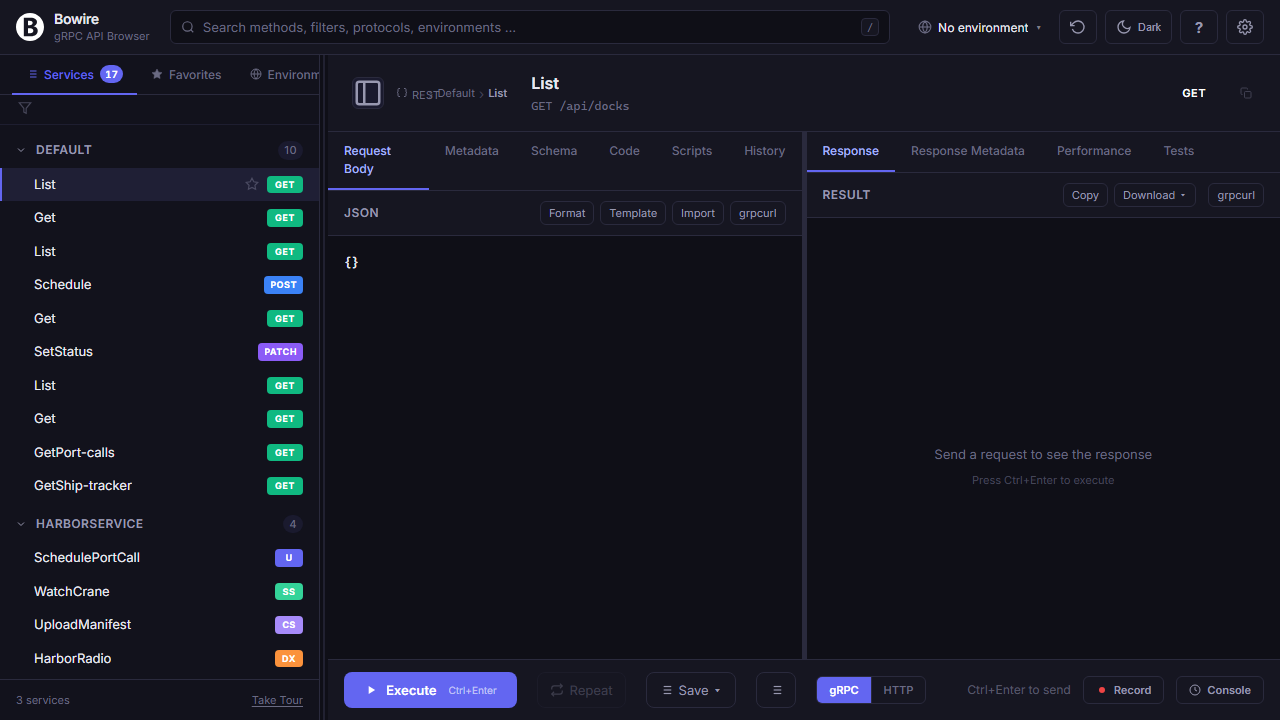
AsyncAPI dispatches through every shipped wire
One asyncapi.yaml, five wire plugins. Each bindings: key the doc declares has a resolver that hands the call to the matching shipped plugin.
The AsyncAPI plugin doesn’t talk to brokers itself — it’s a discovery source that reads the contract and dispatches. Today every active binding maps to a real, shipped plugin: bindings.mqtt / mqtt5 to Kuestenlogik.Bowire.Protocol.Mqtt, bindings.kafka to Kuestenlogik.Bowire.Protocol.Kafka, bindings.amqp / amqp1 to Kuestenlogik.Bowire.Protocol.Amqp, bindings.ws to Kuestenlogik.Bowire.Protocol.WebSocket, and bindings.http through Bowire’s built-in HTTP client.
The benefit: an AsyncAPI doc travels as the contract surface (review it in PRs, version it in Git), but the runtime is whatever wire the broker speaks. Switch from Kafka to MQTT by editing the bindings: block; no Bowire side changes needed.
flowchart LR
    Doc[("asyncapi.yaml")]
    AAPI(["AsyncAPI plugin"])
    Res{"BindingResolver"}
    MQTT(["Protocol.Mqtt"])
    Kafka(["Protocol.Kafka"])
    AMQP(["Protocol.Amqp"])
    WS(["Protocol.WebSocket"])
    HTTP(["HTTP (built-in)"])
    NATS(["Protocol.Nats — follows"])

    Doc --> AAPI
    AAPI -->|"channels · operations · bindings"| Res
    Res -->|"bindings.mqtt / mqtt5"| MQTT
    Res -->|"bindings.kafka"| Kafka
    Res -->|"bindings.amqp / amqp1"| AMQP
    Res -->|"bindings.ws"| WS
    Res -->|"bindings.http"| HTTP
    Res -.->|"binding pending"| NATS
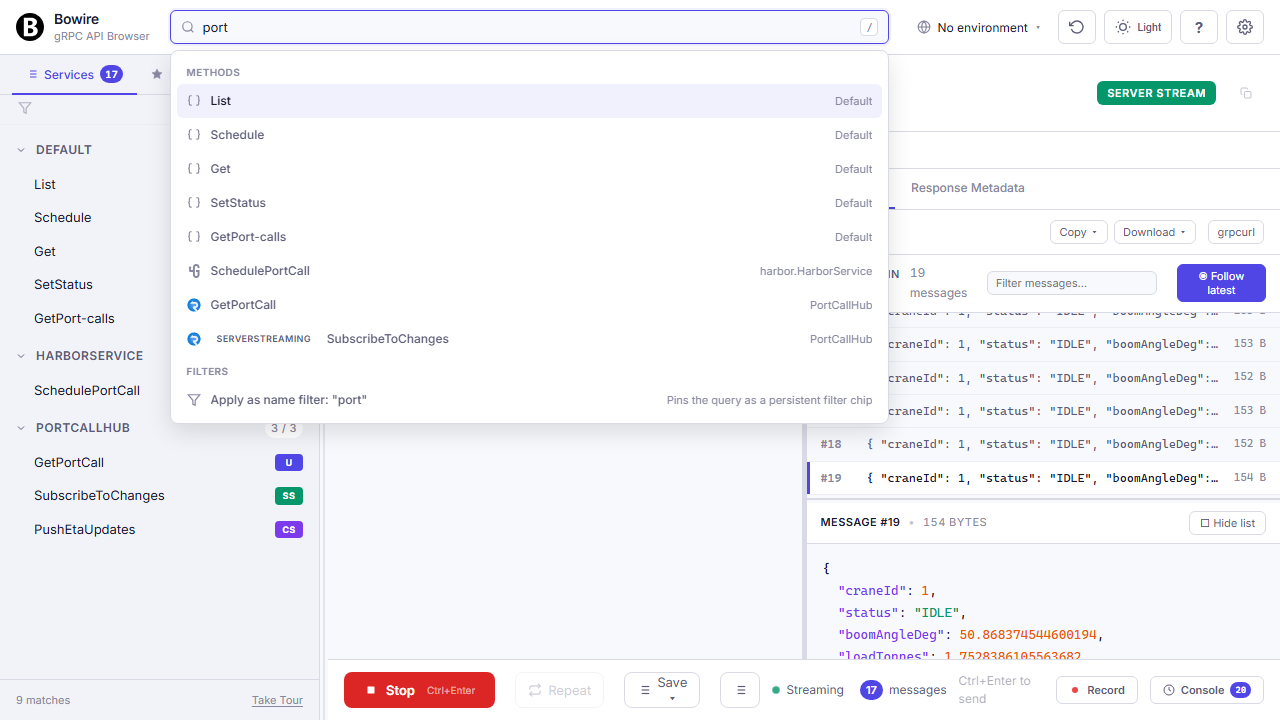
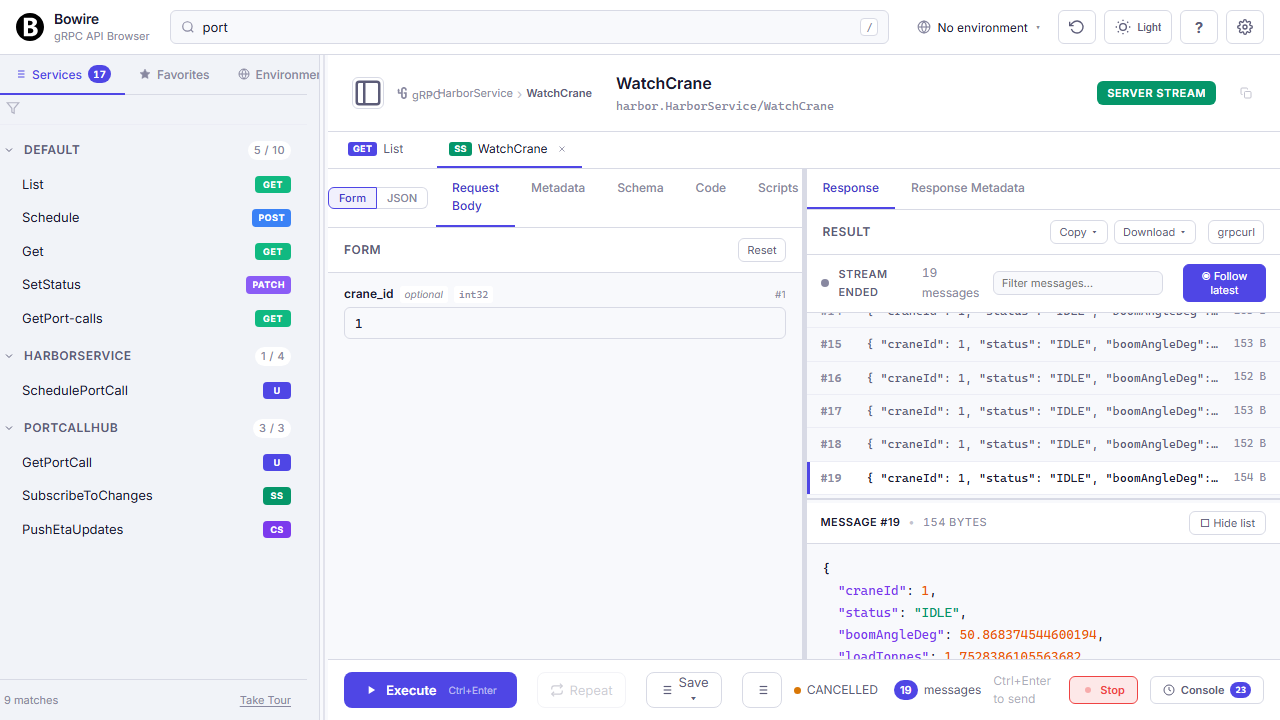
Every call pattern in one UI
Unary, server-stream, client-stream, duplex — plus REST verbs, GraphQL subscriptions, SignalR hubs, raw WebSocket frames, MQTT publishes. One UI, same muscle memory across all of them.
Streaming calls render into a Wireshark-style append-only list with per-frame detail. Duplex / client-stream open a persistent channel with a “send next message” composer on one side and incoming frames on the other. REST maps verbs onto the same invoke pane; GraphQL has a selection-set picker plus subscription follow-up via graphql-transport-ws.
Form or raw JSON
Schema-driven form inputs for the common case, a full JSON editor when you need to tweak something unusual. Toggle with f.
The form view auto-generates controls from the discovered message shape: typed number inputs for int32, date pickers for google.protobuf.Timestamp, dropdowns for enums, nested cards for messages, repeated-field tables. Client-side validation flags missing required fields and type mismatches before a single byte hits the wire.
The JSON view is a full editor with syntax highlighting, bracket matching, and inline validation errors. State is preserved per method, so switching away and back never loses work.
Read the technical docs →{
// typed form mirrors this shape
"city": "Berlin",
"days": 7,
"units": "celsius",
"include_humidity": true,
"filter": {
"after": "2026-04-22T00:00Z"
}
}AI agents drive the workbench via MCP
Pass --enable-mcp-adapter and every method Bowire discovered becomes an MCP tool an AI agent can call directly. JSON Schema input, typed responses, no MCP-server boilerplate to write.
Claude Desktop, Cursor, Copilot, custom MCP clients — same wire, same auth, same recordings as the human-driven workbench. The adapter generates tool definitions automatically from the discovered service tree, so a new method on a running server is callable by the agent within the next discovery tick. Streaming responses surface as MCP streams; auth flows through whichever provider the workbench itself runs under.
Same idea as bowire mcp serve below, but flipped: that one exposes Bowire's own primitives as MCP tools. This one exposes the target API's methods. Run both side by side if you want an agent that can both drive your service surface and orchestrate Bowire's record / mock / replay primitives.
$ bowire --url https://api.example.com \
          --enable-mcp-adapter

   # workbench    http://localhost:5080
   # MCP adapter  http://localhost:5080/mcp
   # 12 discovered methods exposed as MCP tools
Bowire's own ops as MCP tools
bowire mcp serve exposes Bowire itself as an MCP server. The agent can chain discover → invoke → assert → switch env → replay the same way a human would in the workbench, just with more parallelism.
Primitives exposed: bowire.discover, bowire.invoke, bowire.subscribe, bowire.env.list, bowire.record.{list, start, stop, replay}, bowire.mock.{start, stop, list}, bowire.allowlist.show. Two transport modes: stdio for desktop clients (Claude Desktop, Cursor) and HTTP for remote agents (Copilot in CI, custom MCP runners).
Auth piggy-backs on whichever provider the workbench runs under, so the agent never sees a second credentials store. Tools are gated by the same allow-list the workbench uses — an agent can't reach a method a human couldn't.
Read the technical docs →# Stdio — what Claude Desktop / Cursor want
$ bowire mcp serve --bind stdio
# HTTP for over-the-wire clients (Copilot, CI runners)
$ bowire mcp serve --bind http --port 5097Build flows and chain responses
Compose multi-step API sequences visually, forward any response value into the next call, and drive everything from the keyboard.
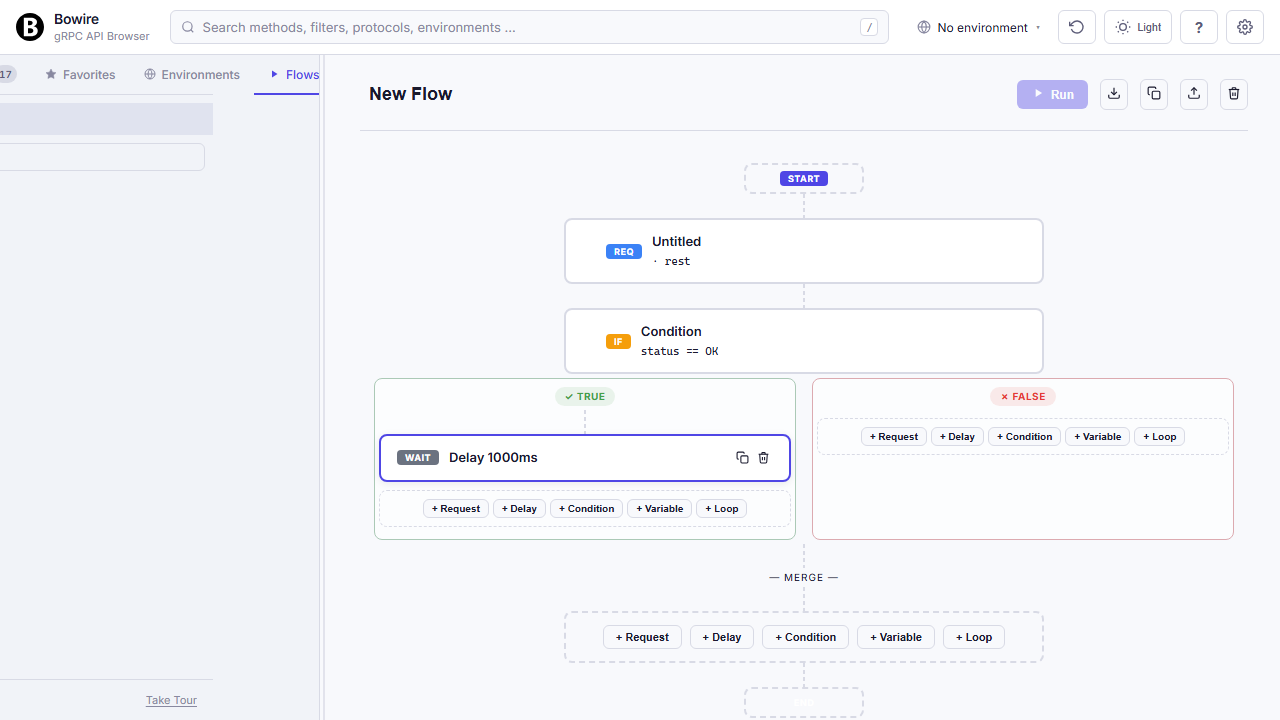
Visual flow editor
Chain API calls into branching pipelines — visually, not in a YAML file you can’t read three months later.
Drag requests onto a canvas, forward response values into the next call with ${response.path.to.value}, branch on status or body content, loop over arrays, sleep, assert. Every node has its own response viewer so you can step through a failing flow like a debugger.
All of it is local to your machine. No seat-counted cloud subscription, no hand-maintained Postman Collections — flows are JSON files you can commit, review, and replay.
Read the technical docs →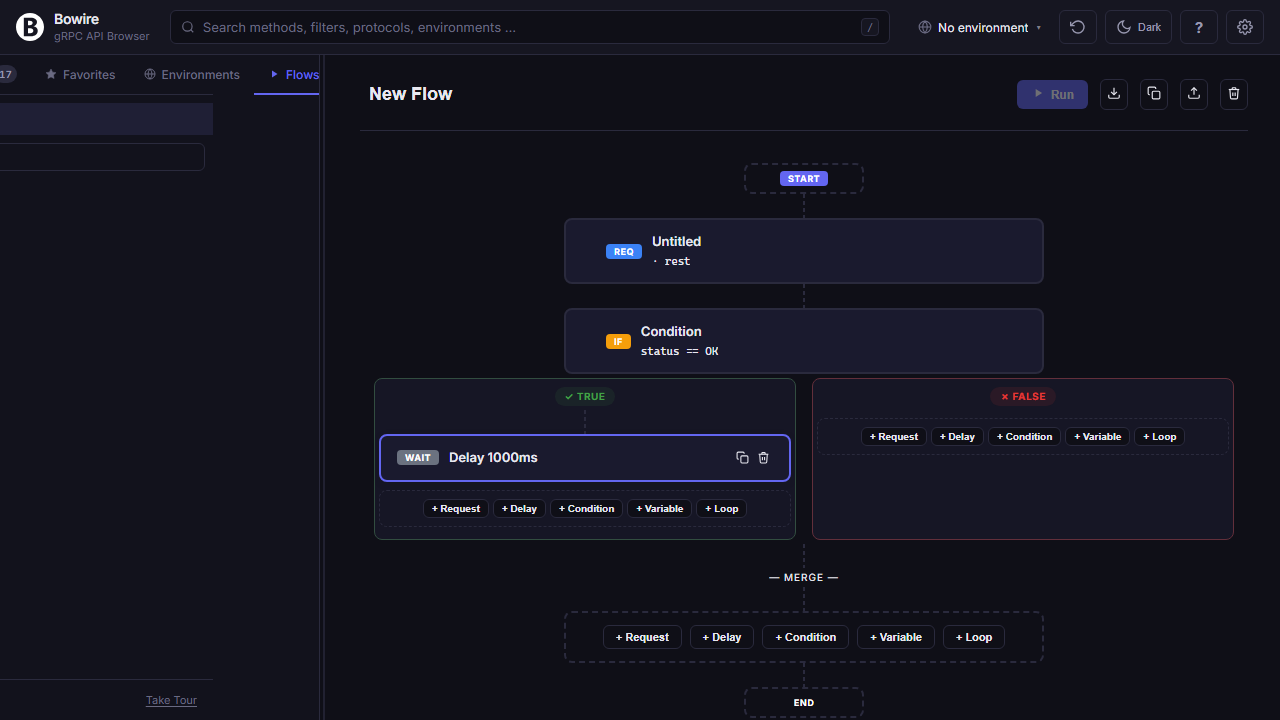
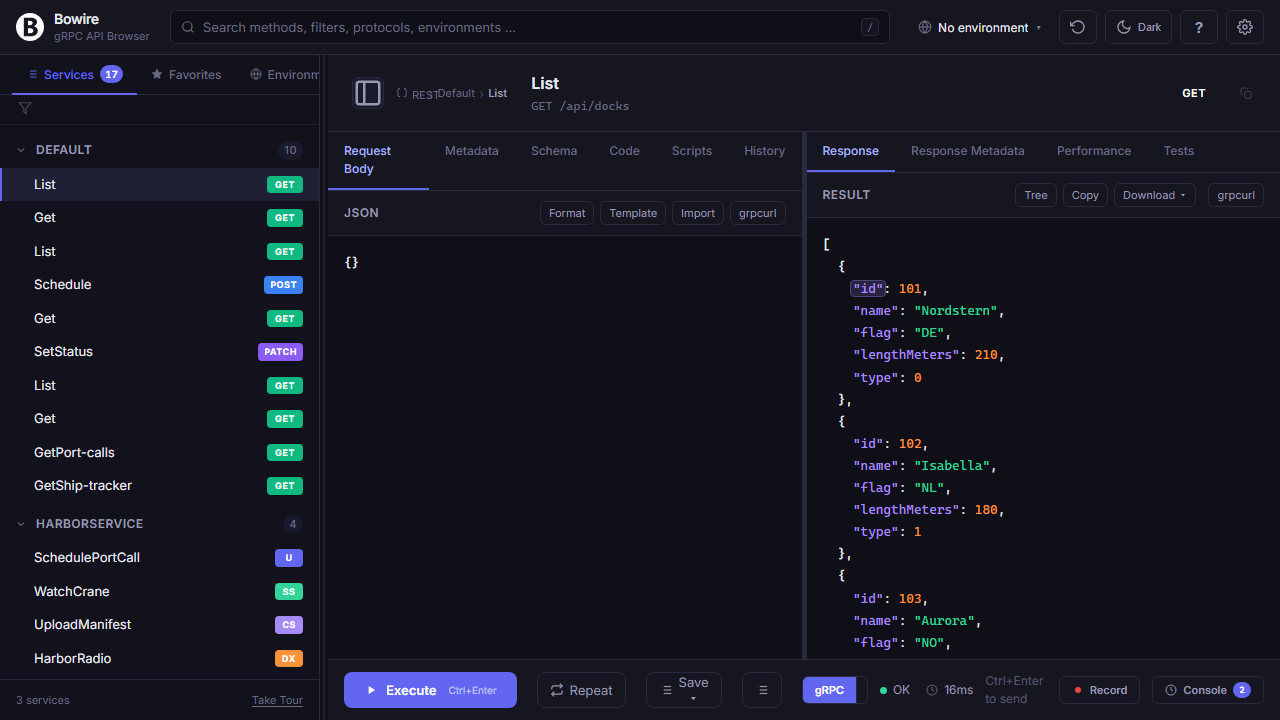
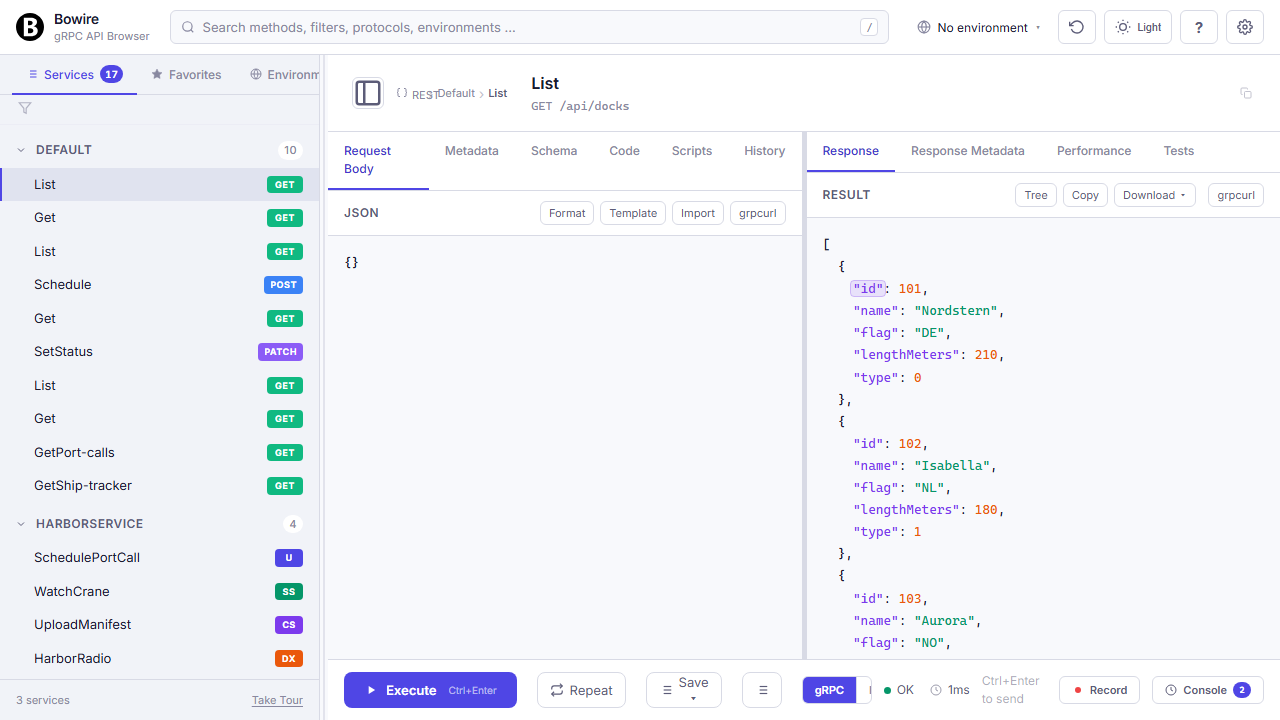
Click any JSON value to chain
The response from one call is the input for the next. Bowire skips the copy-paste round-trip.
Hover any value or key in a rendered JSON response, click it, and Bowire places the chaining expression on your clipboard — ready to paste into the next request’s body, URL path, or headers. Works on every supported protocol, not just REST: gRPC response fields, GraphQL query results, SignalR hub return values, MQTT payloads, SSE events all use the same ${response.path.to.value} grammar.
Command palette & keyboard flow
Press / anywhere to search methods, switch environments, filter protocols — never leave the keyboard.
Vim-style j / k to hop between methods, f to flip form / JSON, r to repeat the last request, t to cycle themes, Ctrl+Enter to execute. Recently-used methods surface when the palette query is empty. Power users who live in the shell will feel at home.
Read the technical docs →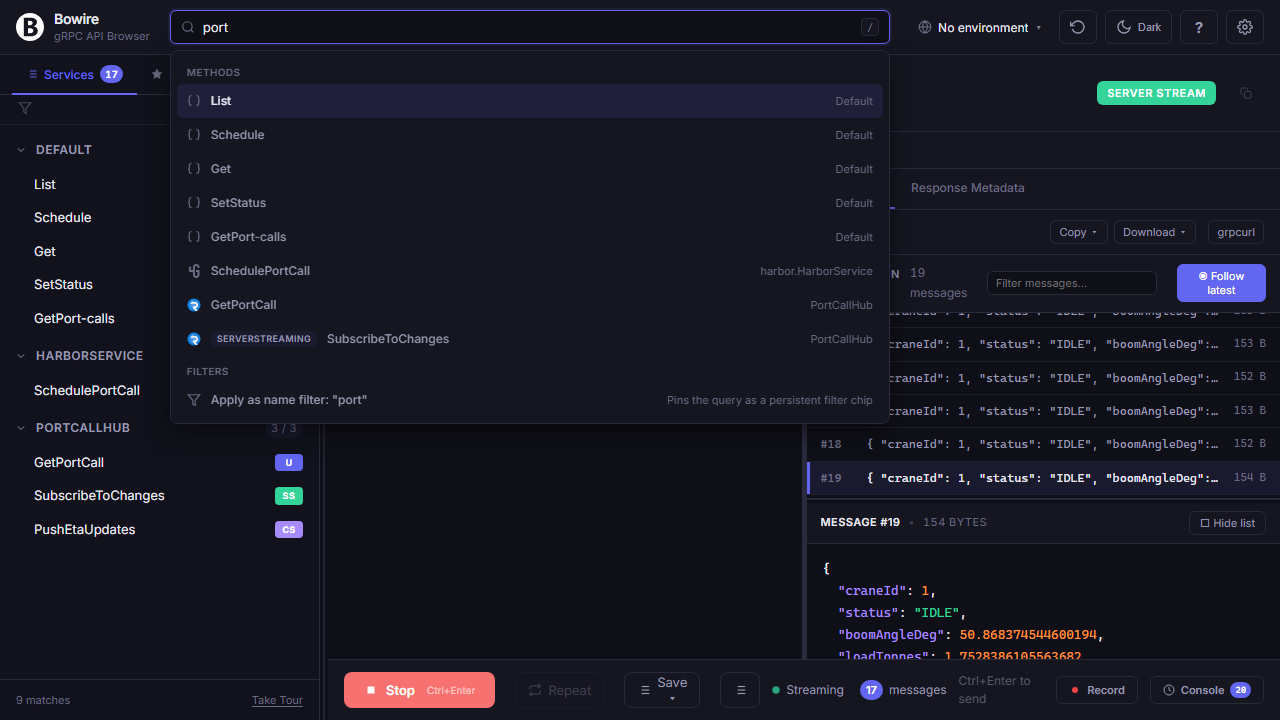
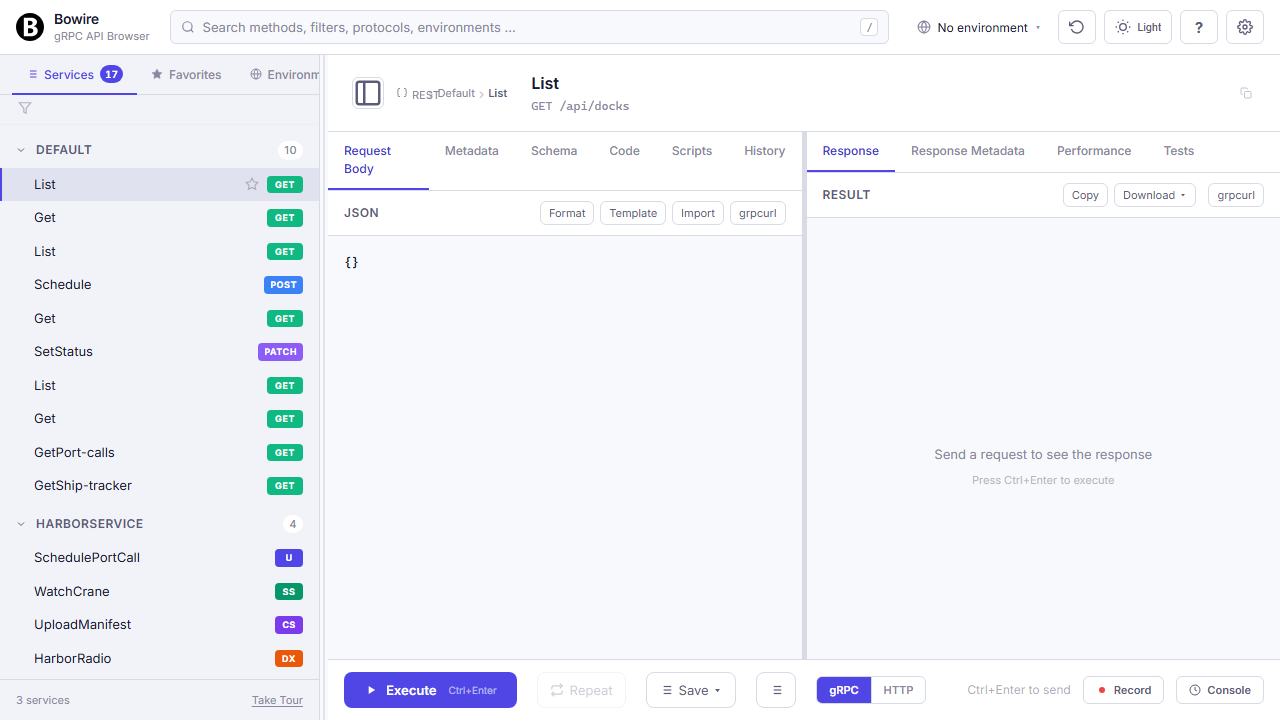
Keyboard-first everything
Every action has a shortcut. Power users never touch the mouse; newcomers get a cheat sheet at ?.
Vim-style j / k to hop between methods in the sidebar, f to flip form ↔ JSON, r to repeat the last request, t to cycle light / dark / auto themes, Ctrl+Enter (or ⌘+Enter) to execute, Esc to close any modal, / to open the command palette, ? to see the full list without leaving the page.
Shortcuts are configurable per-user in Settings → Shortcuts, with conflict detection so the same chord never binds two actions silently.
Read the technical docs →/ open command palette
j / k hop between methods
f toggle form ↔ JSON
r repeat last request
⌘ Enter send request
t cycle theme
Esc close modal
? full cheat sheetCapture, replay, and stress
Every call captured in a filterable timeline, replayable against any environment, and ready for a quick load check — all in the same workbench.
Record & replay
Click record, run a sequence of calls, click stop. Now you have a reproducible test case, a debug artifact, and a future mock server in one file.
Recordings capture request, response, status, timing, and metadata for every call across every protocol — gRPC streams, SignalR hub invocations, WebSocket frames, MQTT publishes, REST hits, all in one timeline. Replay against another environment to check drift, convert into test assertions for CI, export as HAR for teammates, or serve the recording back as a live mock (see the next block).
Read the technical docs →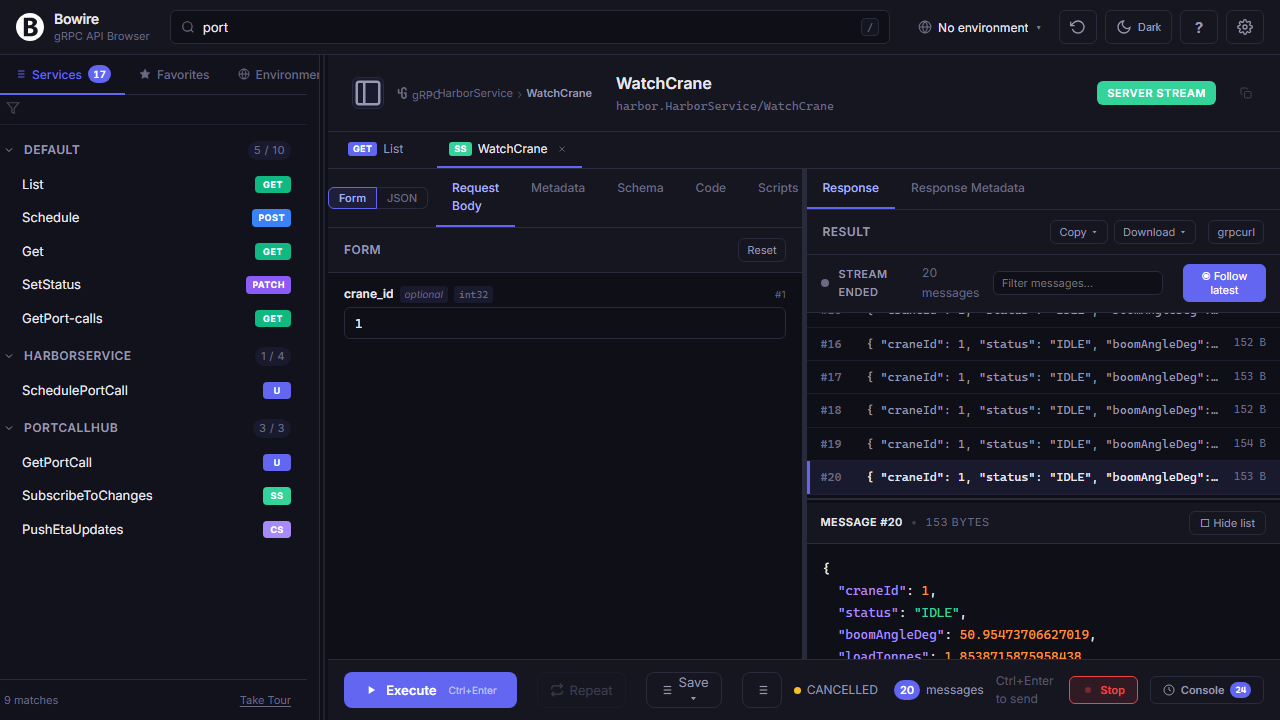
Replay recordings as a live mock server
bowire mock --recording session.bwr --port 5099 turns any captured recording into a live endpoint at the same shape as the original — so dev / test runs don't have to stand up the real backend.
The real backend is friction. The third-party API needs an OAuth flow + a paid subscription that burns credits on every test run. Your own service is a 12-container docker-compose with a 5-minute boot. The CI runner sits behind a corporate VPN that doesn't reach the upstream at all. A captured recording cuts all of that out of the loop — the fixture is the JSON file, drop it on a USB stick, drop it in a Git repo, hit replay.
Every protocol your recording captured replays through the same listener — REST verbs on the same paths, gRPC unary + server-streaming + bidi with the captured frames, WebSocket / SSE / SignalR / Socket.IO pushing the same sequence, MQTT publishes hitting the same topics, GraphQL subscriptions streaming the same events. Protocol semantics stay intact (status codes, frame timing, headers) instead of collapsing everything to a JSON stub.
Optional layers on top: hot-reload — rewriting the recording file refreshes the mock without restart; chaos injection — configurable latency / 5xx rate / dropped-frame ratio for resilience tests; schema-only mode (--from-spec openapi.yaml) — plausible responses from an OpenAPI / gRPC descriptor / GraphQL schema with no recording at all; capture-on-miss — unrecorded request transparently forwards to a fallback target, captures the response, serves it back next time.
$ bowire mock \
    --recording session.bwr \
    --port 5099 --hot-reload

   # mock listening on 0.0.0.0:5099
   # 42 calls loaded across gRPC, REST, WebSocket
Multi-protocol security scanner
bowire scan --target https://your-api --out findings.sarif runs vulnerability templates against the API surface Bowire already discovered, and emits SARIF 2.1.0 that your CI ingests unchanged.
Two template sources at once: Bowire's own JSON templates (curated baseline shipped in Bowire.VulnDb) plus the 8000+ projectdiscovery/nuclei-templates via --nuclei <dir>. Both feed Bowire's native AttackPredicate engine — same matchers, same payload variables, no separate runtime.
Findings emit as SARIF 2.1.0 — straight into GitHub Code Scanning, GitLab Security Dashboard, Azure DevOps. Built-in passive checks (TLS-version enumeration, version-disclosing headers, verbose-error detection) fire on day one without writing a template. Gating happens at the SARIF-consumer level (Code Scanning branch-protection rules) so the scan step itself stays linear.
See the security solution overview →$ bowire scan --target https://api.example.com \
--nuclei ~/nuclei-templates \
--out findings.sarif --severity medium
142 template(s) processed:
[ok] built-in.tls-1.0 medium
[VULN] built-in.banner-disclose low Server: nginx/1.18.0
[VULN] CVE-2024-12345 high /api/v1/admin (header bypass)
SARIF report -> findings.sarifSchema-aware field-level fuzzer
bowire fuzz mutates one field at a time using the schema Bowire already knows. Knows not to throw SQL-injection at a latitude (lat) field; image.bytes gets magic-byte mutation, not XSS strings.
Schema-awareness is the differentiator: the fuzzer respects field types from the discovered schema (OpenAPI / proto / GraphQL / AsyncAPI). Image-byte fields get magic-byte / truncation / over-length mutation, integer fields get boundary / overflow / negative mutation, dates get format / range mutation, strings get the category-appropriate payloads.
Four payload categories ship out of the box: sqli, xss, pathtrav, cmdinj with curated wordlists. A baseline-diff oracle flags responses that look materially different from the baseline — status change, error-shape divergence, latency spike beyond N standard deviations. Findings reuse the same SARIF emitter as scan, so they drop into the same Code-Scanning surface.
$ bowire fuzz \
--target https://api.example.com \
--template recordings/order.bwf \
--field '$.customer.email' \
--payloads sqli,xss --out fuzz.sarif
payloads tried: 42
baseline runs: 5
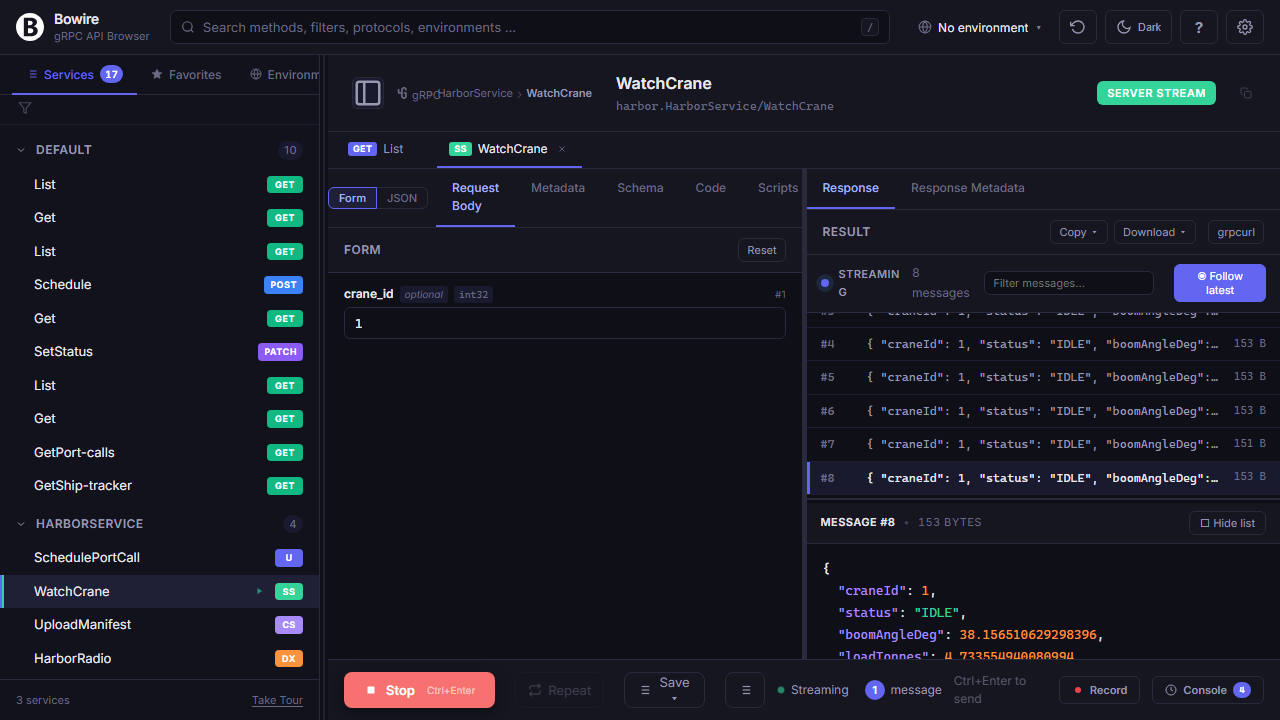
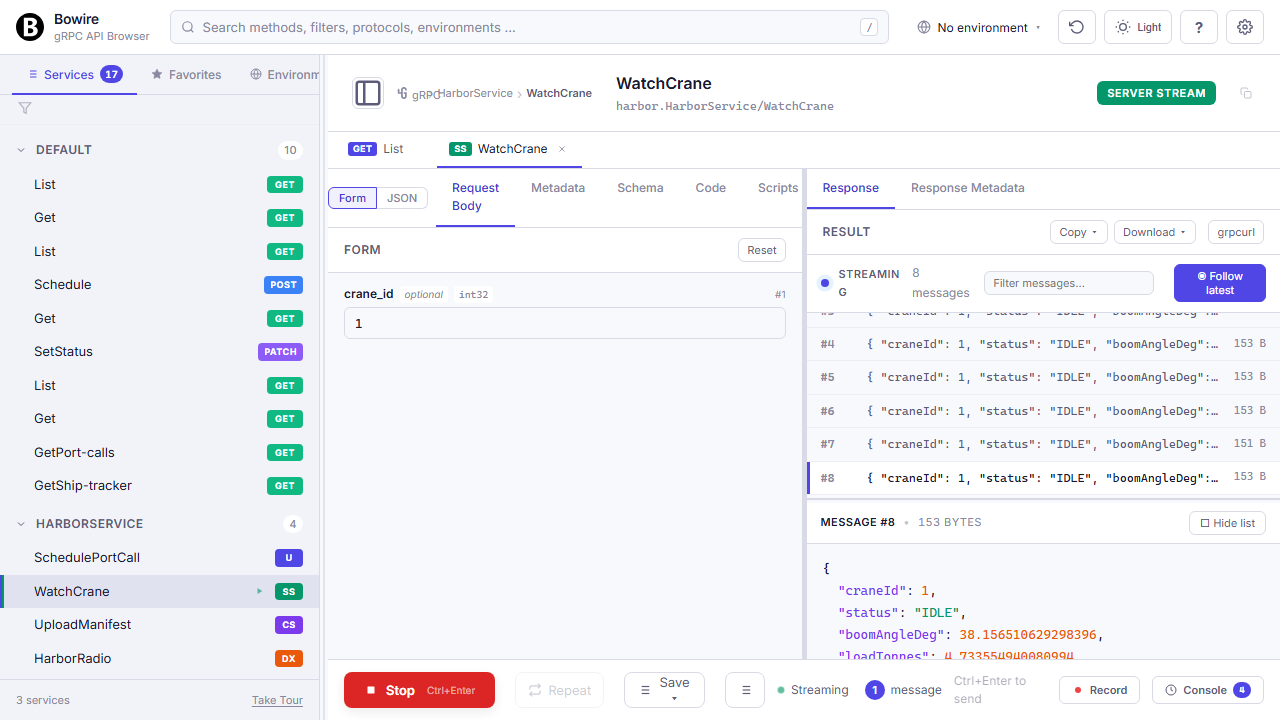
divergent: 3 (status 500, latency >3σ)Wireshark-style streaming view
An append-only message list on the left, a detail pane on the right — built for long-running duplex sessions, not a chat transcript.
Every incoming frame lands in a filterable table (substring, regex, or protocol-specific fields). Click one to see the full payload. Pin the latest to auto-follow, or pin a specific frame to keep the detail view stable while new messages scroll in. Works for gRPC server / client / duplex streams, SignalR real-time events, GraphQL subscriptions, WebSocket frames, SSE events, and MQTT subscribe streams — all with the same UI.
Read the technical docs →
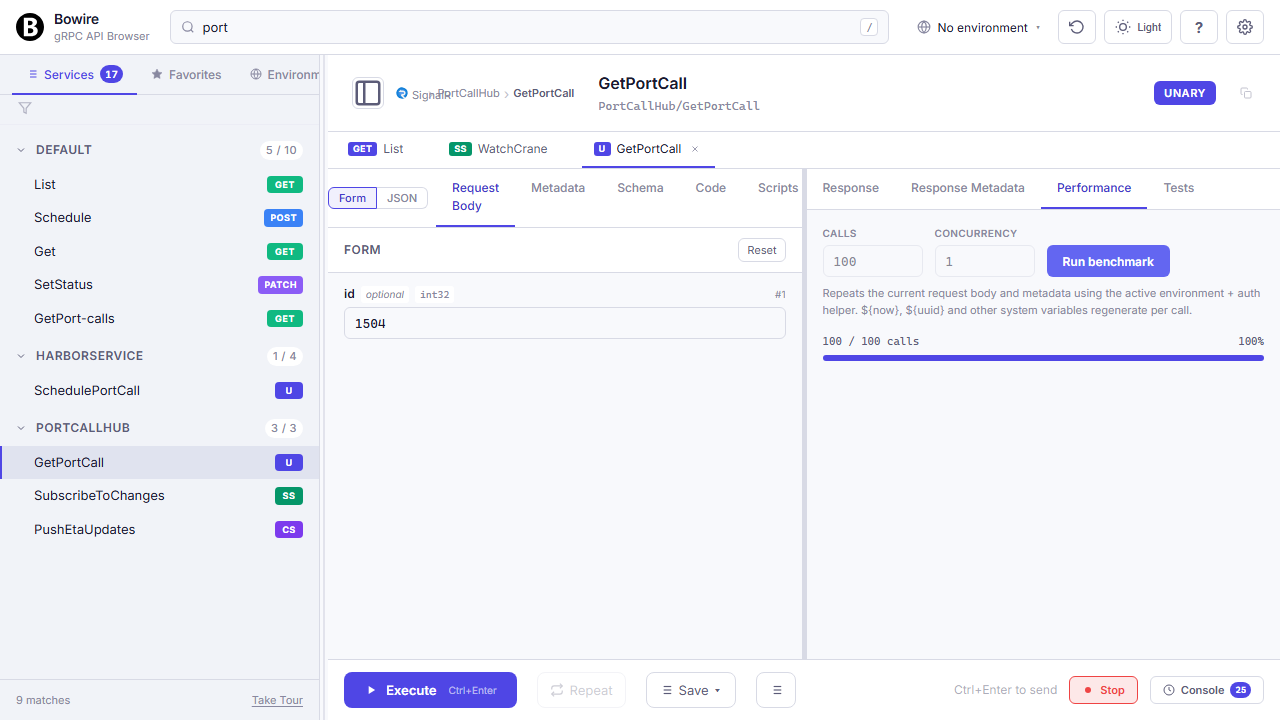
Performance testing, built in
Repeat any call N times, watch the latency histogram and timeline render in real time.
P50 / P90 / P99 / P99.9 percentiles, success rate, and throughput all in the same pane as the request. No separate load tool to install, no CI pipeline to wire up — just a quick “is this endpoint holding up?” check when you suspect a regression. Scales enough for smoke tests; for full-blown soak tests, export the call as k6 / vegeta and run it from a proper load runner.
Read the technical docs →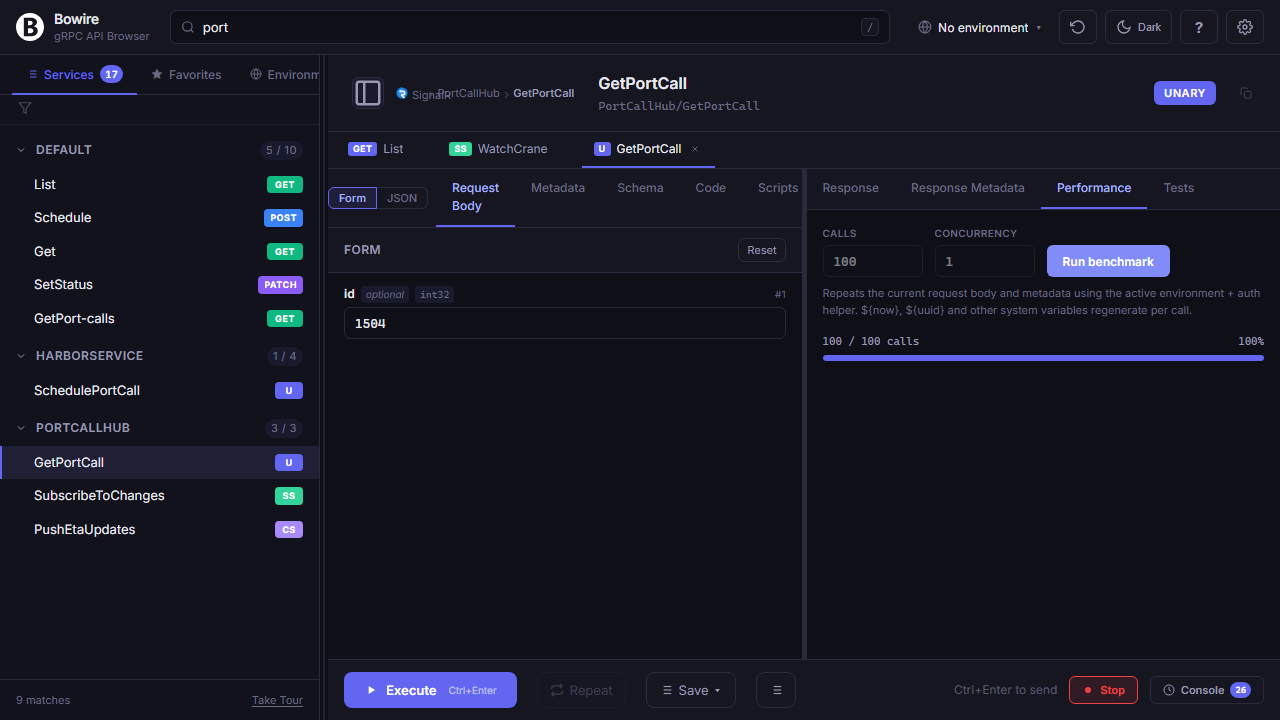
Inline test assertions
Write Newman-style checks once, Bowire runs them after every successful response and shows a green / red badge inline.
Eleven comparison operators (eq, ne, gt, gte, lt, lte, contains, startsWith, endsWith, matches, type) target any value via response.path.to.value JSONPath. Assertions are stored per method, replay with every invocation, and can be exported into a recording so a flow becomes its own regression test.
For streaming responses, assertions run on the accumulated frames — “expect at least 3 frames of type TICK within 2 s” is one rule. No plugins, no pipeline, just a test that lives next to the request.
Read the technical docs →response.status eq 200 ✓
response.time lt 500 ✓
body.user.id eq "42" ✓
body.items[0] type "object" ✓Environments, schemas, and setup
Compare what’s actually running where, work from a schema when the server isn’t reachable, authenticate against any auth scheme, and script everything from the CLI when you don’t want the UI.
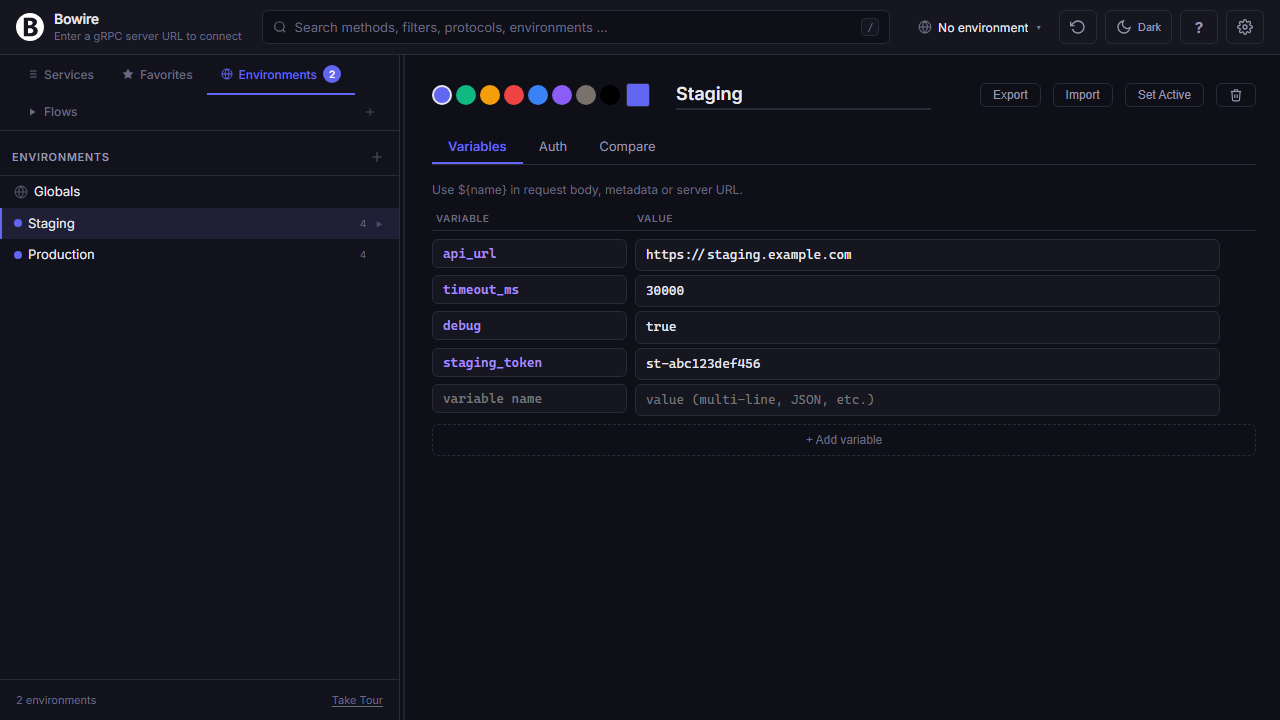
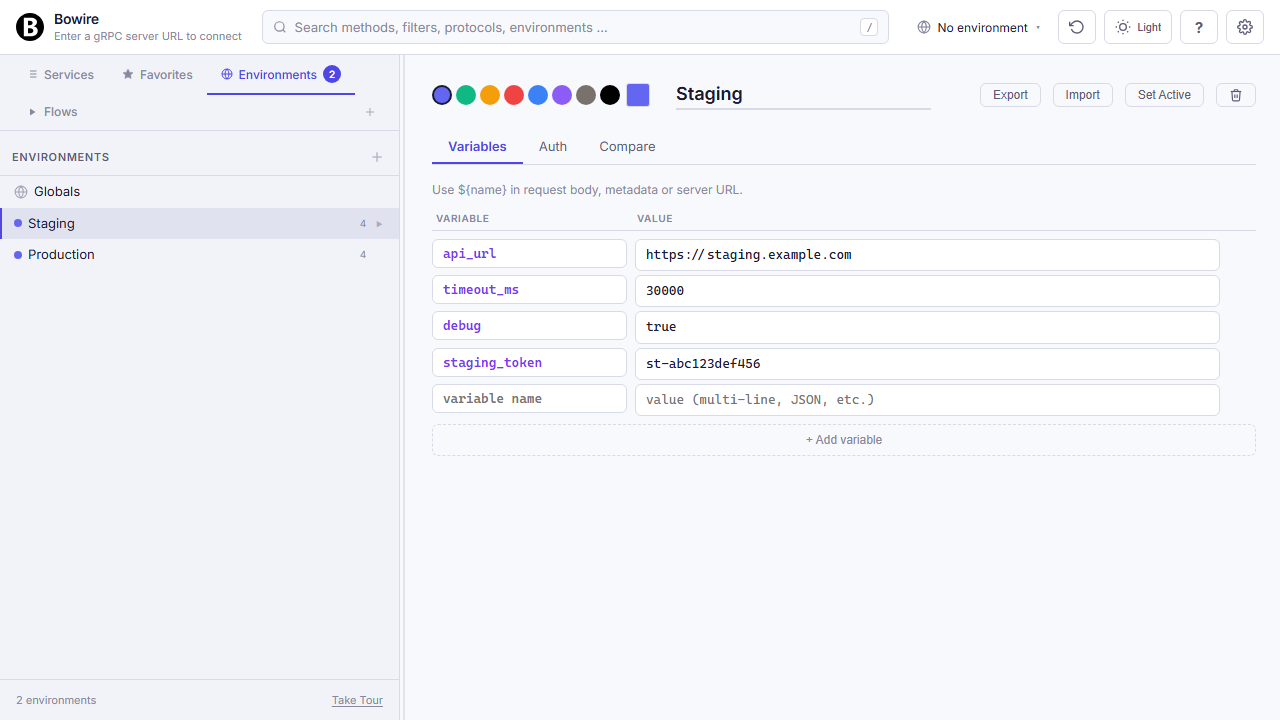
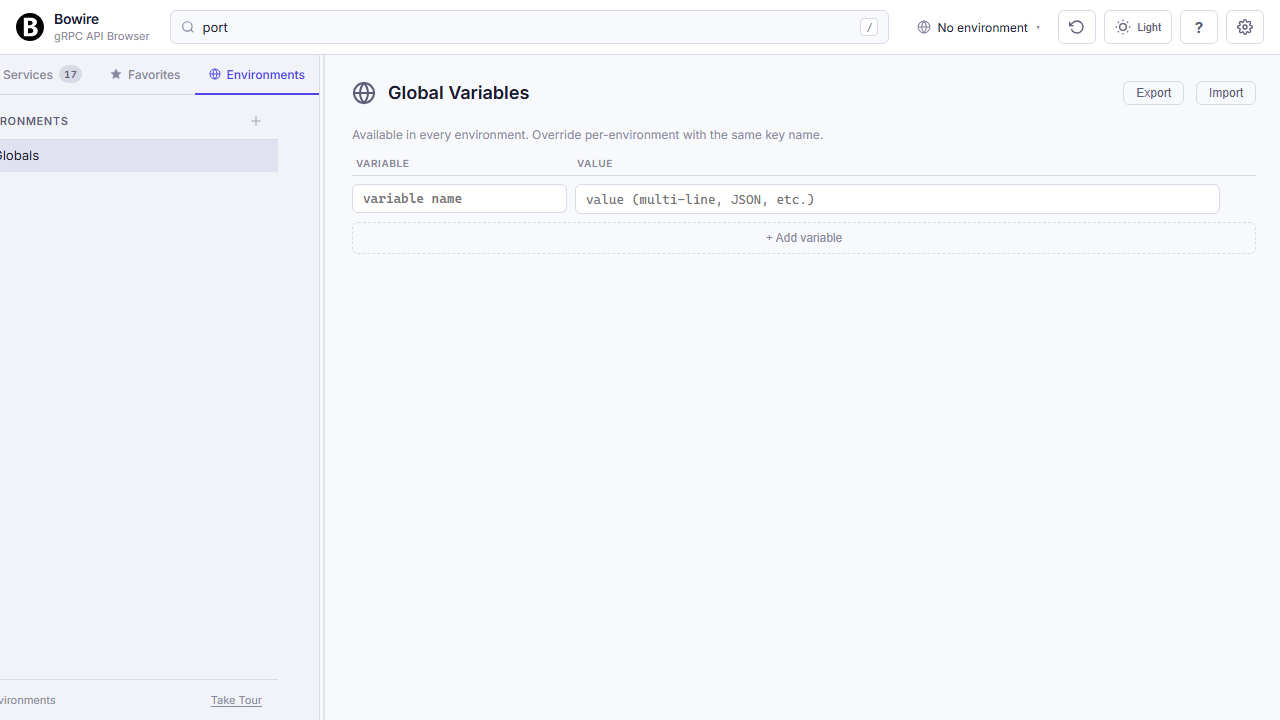
Globals and Environments
A typed variable store per environment, plus a Globals layer everyone inherits — the same ${name} you'd reach for in any HTTP client, scoped properly.
Define Globals once (machine-wide constants you never change — timeouts, retry-counts, the base URL of your local Docker registry) and per-environment named scopes on top of them (Dev, Staging, Production, …). Variables surface as ${api_url}, ${timeout_ms}, ${prod_token} in any request body, metadata header, URL field, script — the workbench substitutes at request time with the resolution chain Globals → active environment, per-environment overrides winning by name.
Variables persist to ~/.bowire/environments.json on disk (the workbench mirrors them to localStorage for instant access). Export / Import buttons round-trip the full env set as a .bwe file — commit it to your repo, share it with a colleague, restore it on a fresh laptop. Switching the active environment from the topbar instantly re-resolves every ${...} in the request editor so a single keystroke flips between dev and prod without a single textual edit.
Environment diff
Compare two environments side-by-side — spot drift before it hits production.
Pick any two configured environments (Dev, Staging, Prod, or per-URL overrides) and get a colour-coded diff across every variable and header. Equal rows are folded away, changed rows highlighted, only-in-A / only-in-B clearly marked. Catches missing secrets, mistyped keys, and accidental overrides that would otherwise burn an afternoon of debugging.
Read the technical docs →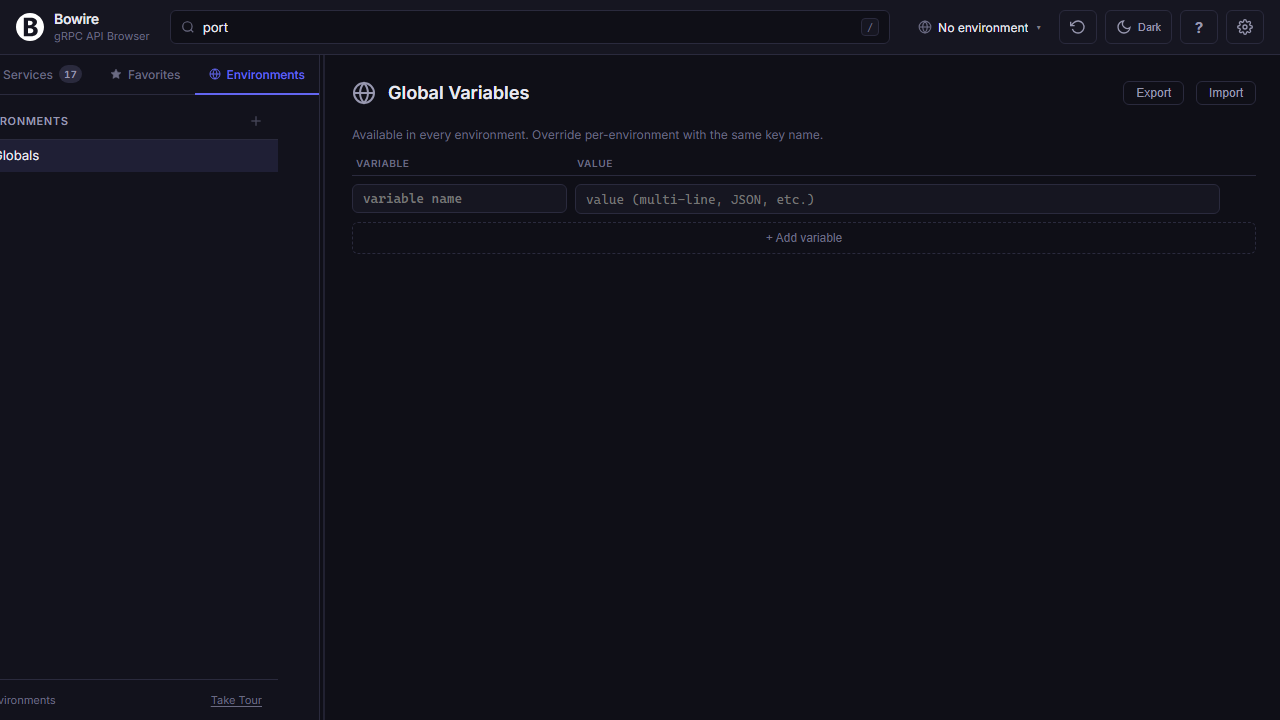
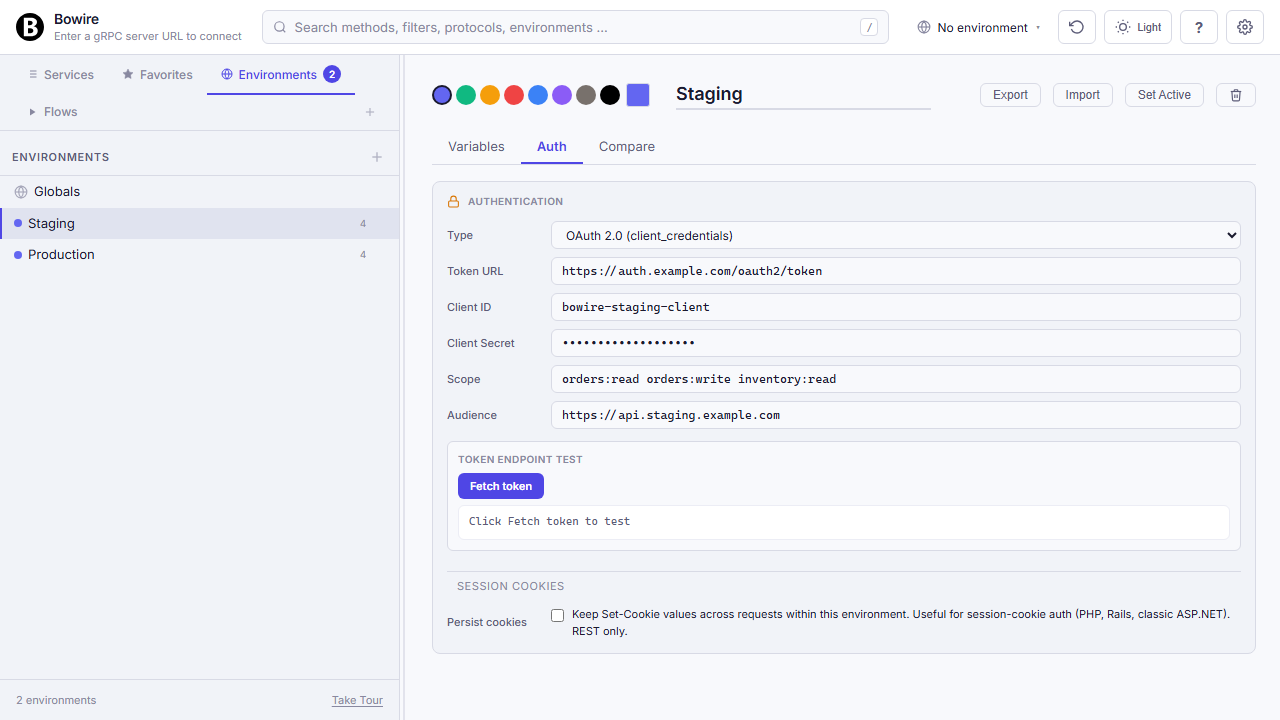
Every auth scheme, built in
Every auth scheme worth supporting, built in. Set it once per environment, Bowire signs every request.
Bearer tokens, HTTP Basic, API Key (header or query), JWT issuance (HS256 / RS256 / ES256) with custom claims, OAuth 2.0 client_credentials, OAuth 2.0 authorization_code with PKCE for local CLI flow, a custom token endpoint with auto-refresh, and AWS Signature v4 for S3 / Lambda / API Gateway. Each scheme stores its values in the environment, substituted at request time — tokens never touch the page source.
Expired tokens refresh transparently. Metadata headers on gRPC, authorization headers on REST / GraphQL / SignalR / WebSocket / MQTT (Username-Password CONNECT) all share the same credential store.
Read the technical docs →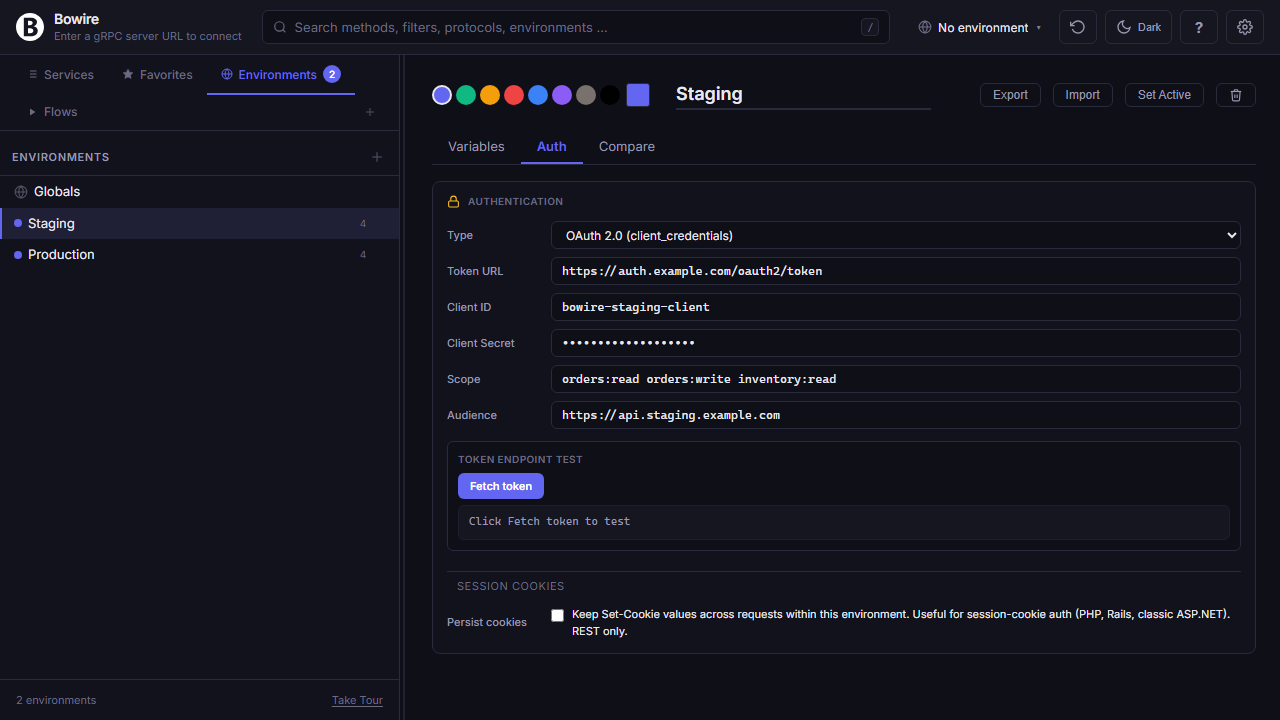
Work offline from a schema file
Drop in a .proto, OpenAPI spec, GraphQL SDL, or AsyncAPI document — browse the API surface without a running server.
Great for reviewing a contract during a PR, sharing a service’s shape with a teammate who can’t reach staging, prototyping a client before the backend exists, or teaching someone what an API looks like without spinning up infrastructure. Supports .proto (buf-style imports included), OpenAPI 3 / Swagger 2, GraphQL SDL, and AsyncAPI 2.x / 3.0 — other formats via plugin.
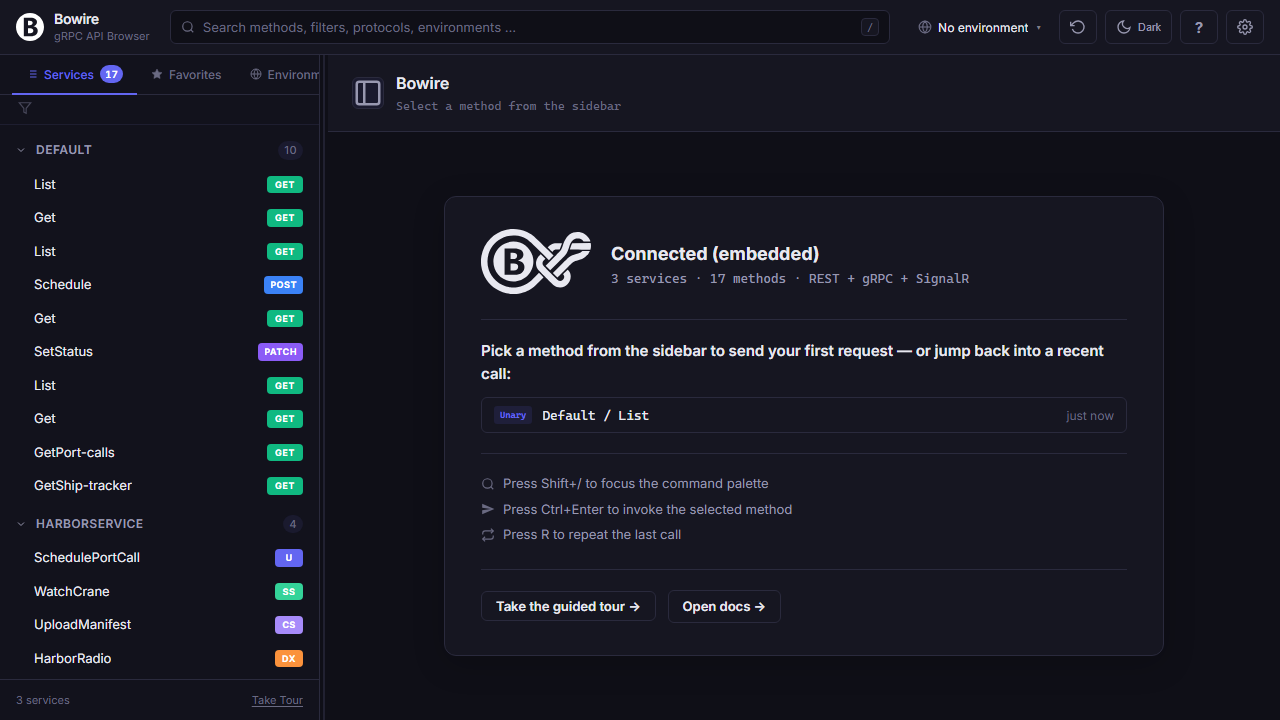
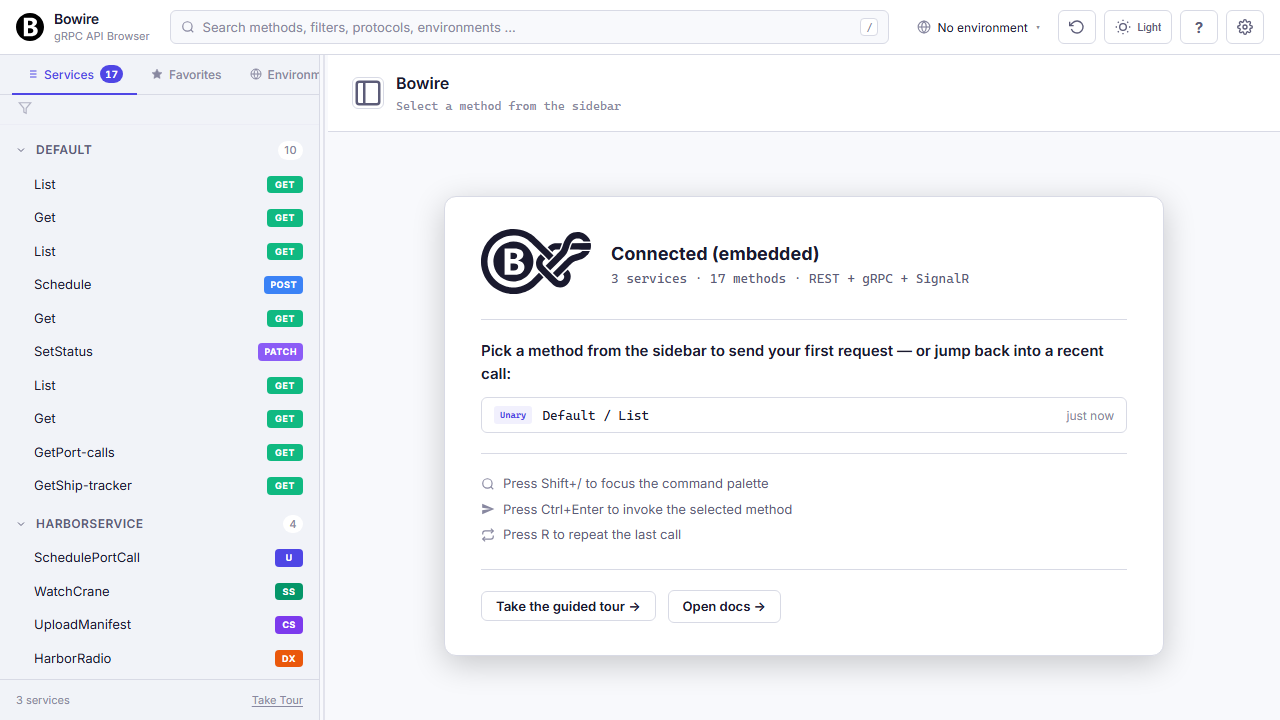
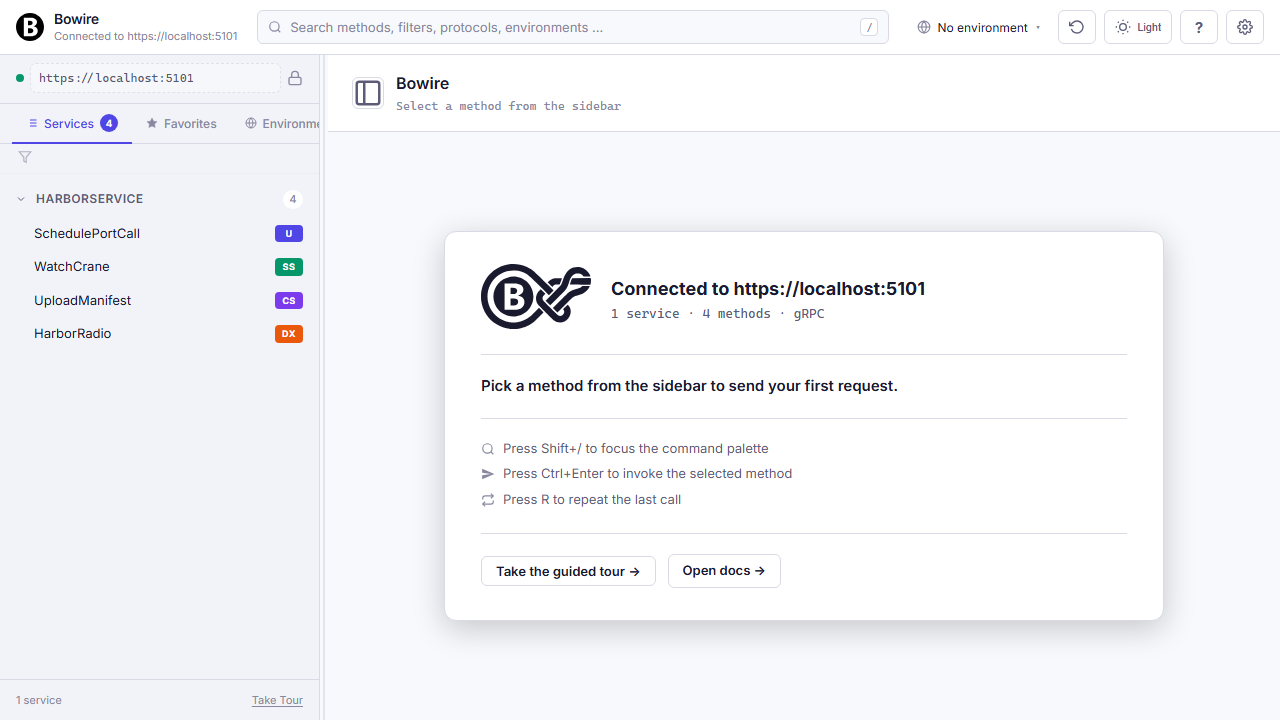
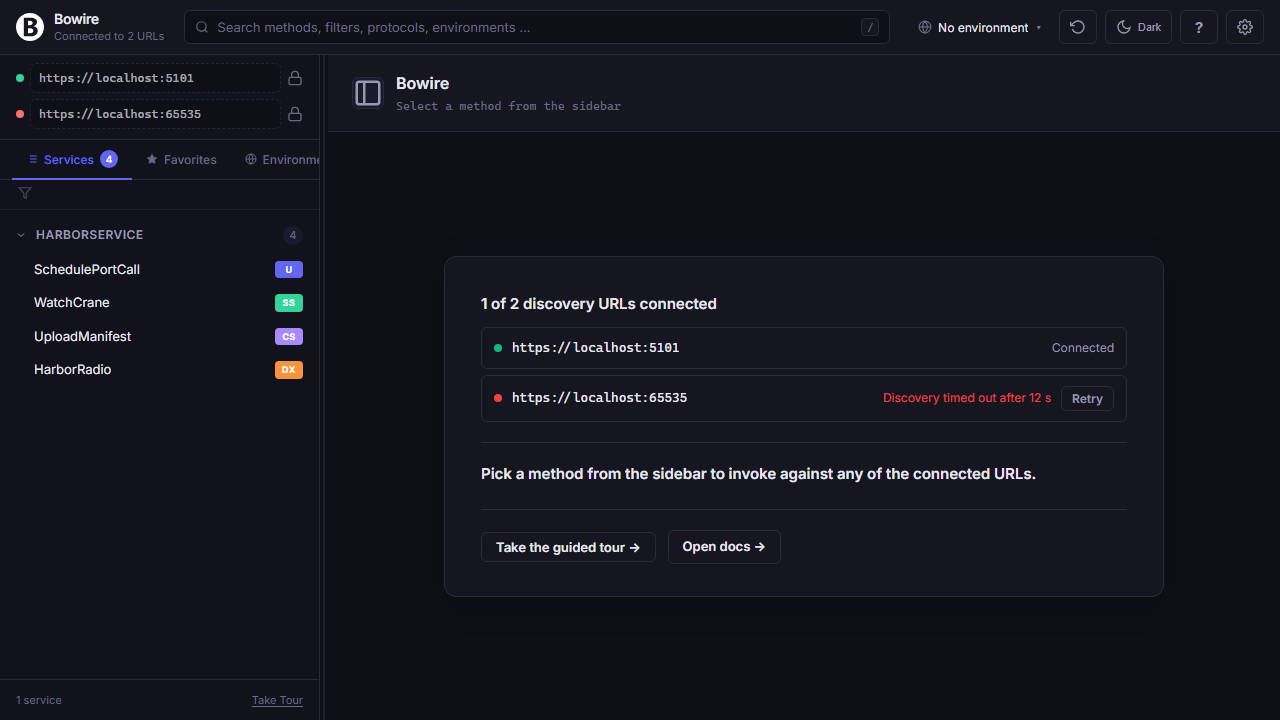
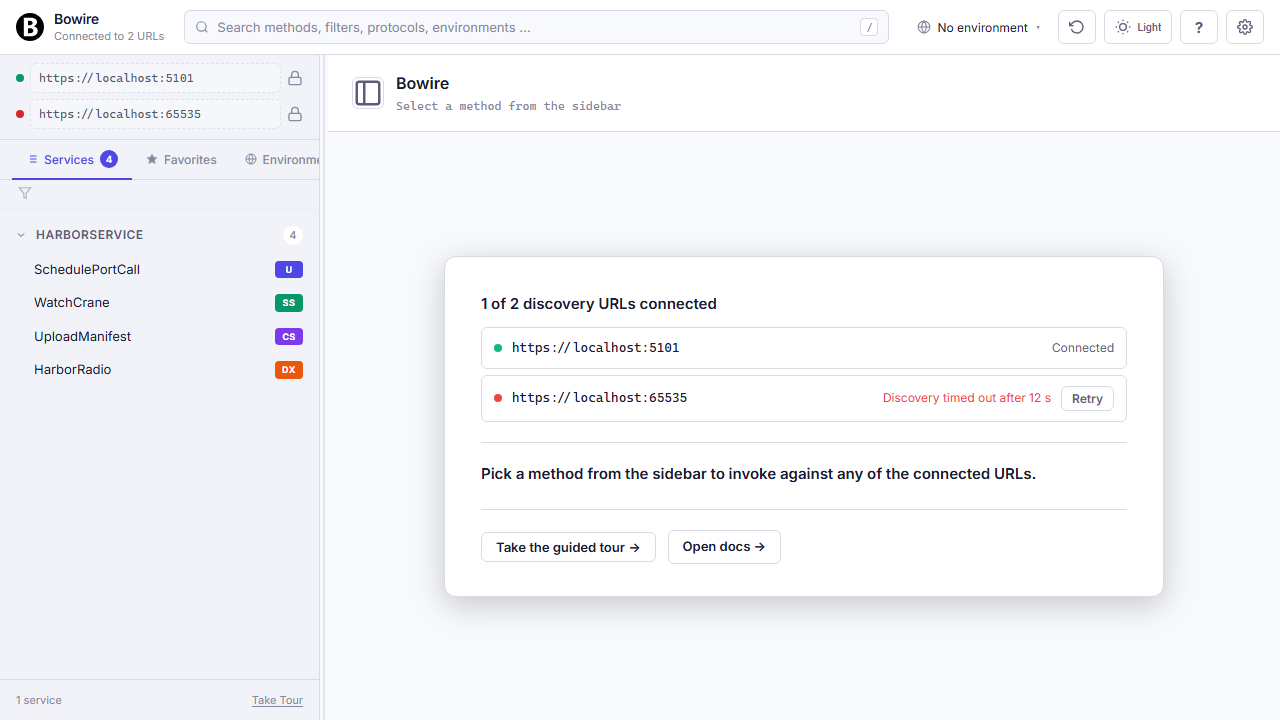
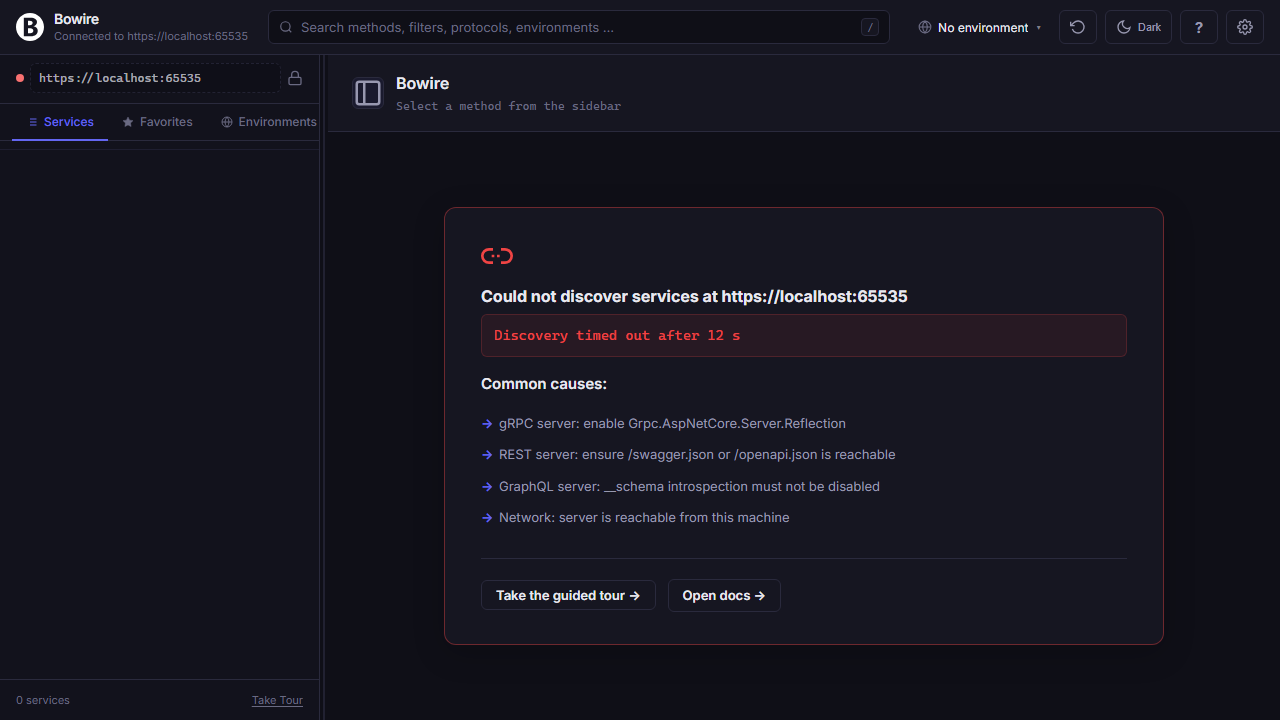
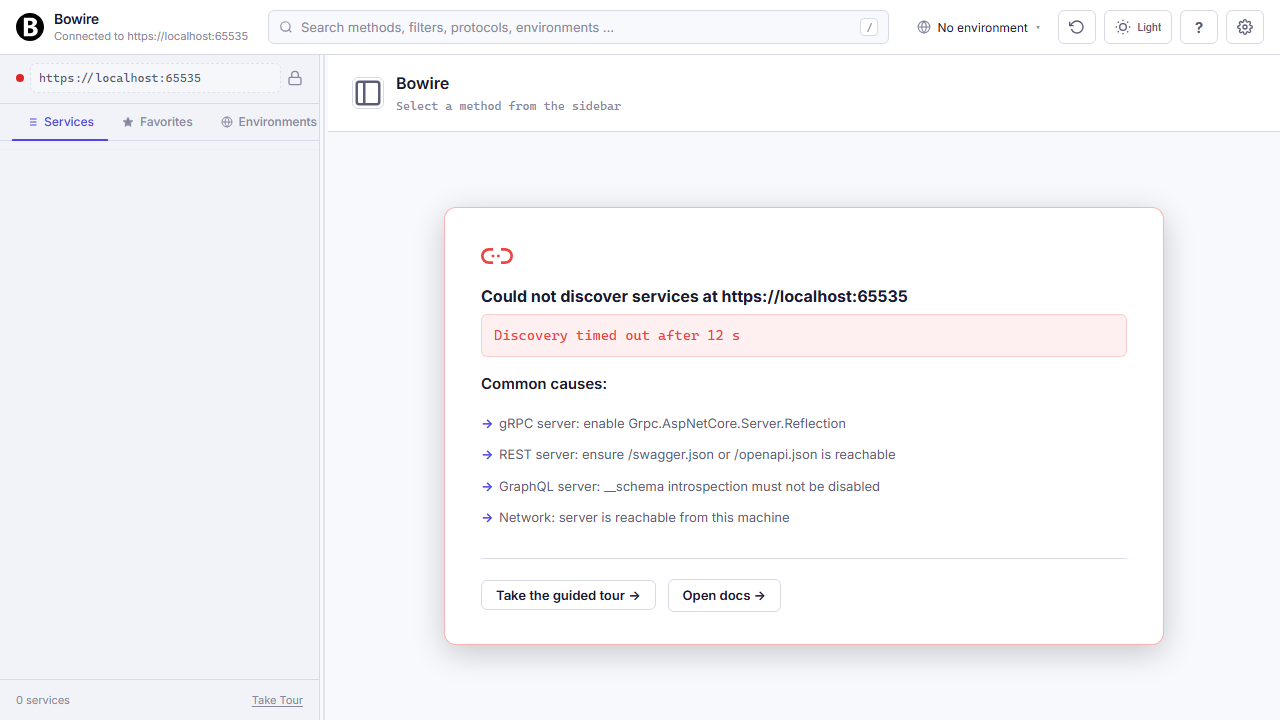
Smart empty states
Every screen where Bowire could be blank has something useful instead — a welcome, a retry, a diff of what connected and what didn’t.
First-run without a --url gets two onboarding paths: connect to a live server, or drop in a schema file for offline browsing. When discovery fails, the page surfaces the actual error plus four common-cause troubleshoot bullets. With multiple URLs configured, a per-URL status table lets you retry the ones that failed without touching the ones that connected.
When everything works, the landing shows a service summary, recent-history quick-recall, keyboard shortcut tips, and a guided tour entry point for new team members.
Read the technical docs →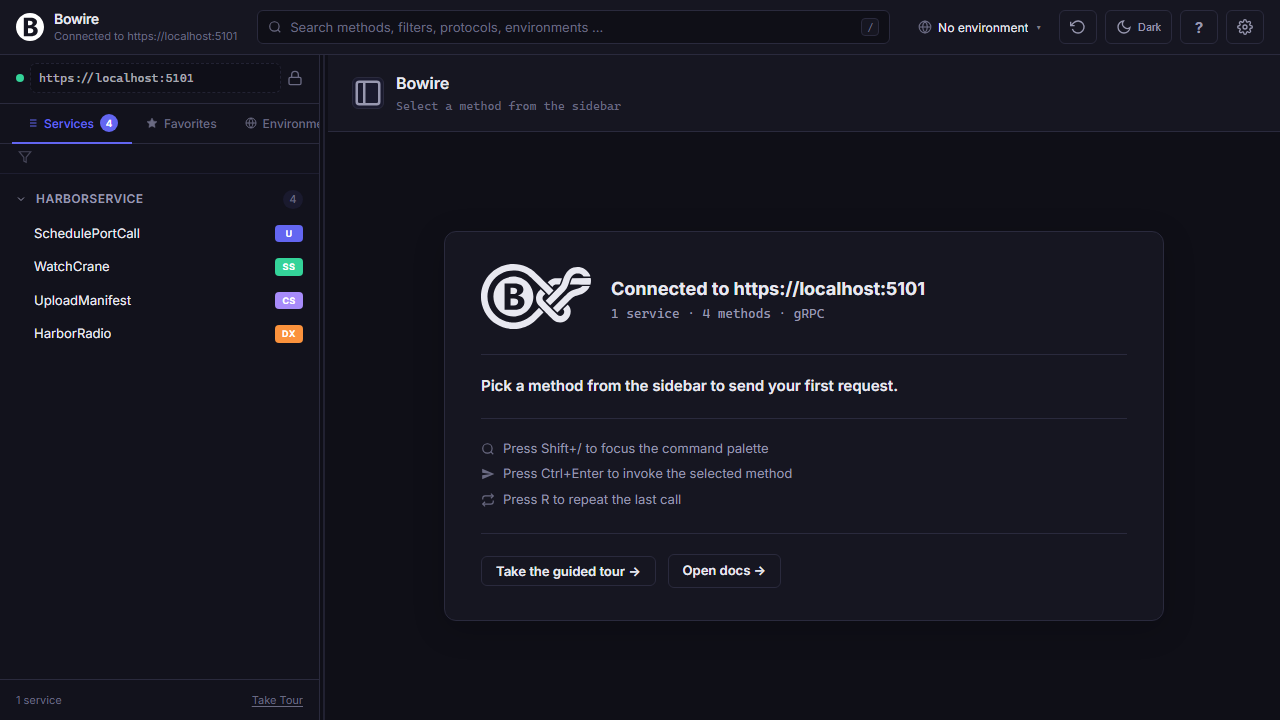
No CORS proxy to set up
Bowire talks to any API — local, internal, cloud — without browser-CORS friction. The architecture is the proxy.
The UI only ever hits localhost:5080 (same-origin, no CORS involved). The actual gRPC, REST, GraphQL, WebSocket, SSE, MCP, and MQTT calls are made by the Bowire process server-to-server, not from the browser. Same-origin policy doesn’t apply to server-to-server traffic, so endpoints without permissive CORS headers still work — no proxy layer to configure, no dev-tunnel to spin up, no *-origin security hole to poke.
It’s the reason you can browse a staging gRPC cluster or an internal REST service from your laptop without the backend team adding Access-Control-Allow-Origin.
flowchart TD
    Browser(["Browser"])
    Host(["Bowire host"])
    API(["Target API"])
    Browser -->|"localhost:5080 (same-origin, no CORS)"| Host
    Host -->|"upstream (server-to-server, no SOP)"| API
localhost:5080 — same-origin, so CORS never enters the picture. Bowire makes the upstream call (gRPC, REST, WebSocket, MQTT, …) server-to-server, where same-origin policy doesn’t apply.Install, update, inspect — protocol plugins as NuGet packages
Every protocol plugin is a NuGet package. bowire plugin install fetches it, update bumps it, inspect shows what's loaded. No dotnet restore detour, no .NET SDK required at install time — only the runtime.
Plugins install into ~/.bowire/plugins/ (override via --plugin-dir or appsettings.json), each in its own isolated AssemblyLoadContext so two plugins can ship different versions of the same third-party library without clashing. Shared contract assemblies (Kuestenlogik.Bowire.*, System.*, Microsoft.*) delegate to the host so IBowireProtocol stays type-identity-identical across the boundary.
Need a private feed? --source https://nuget.mycorp.internal/v3/index.json is repeatable; multiple sources are tried in order. bowire plugin inspect MyCompany.Protocol.X loads the plugin live and reports the load-context, the resolved version, every assembly it pulled in, and every IBowireProtocol implementation reflection finds — instant verification that a freshly-packed plugin is wired correctly.
$ bowire plugin install Acme.Bowire.Protocol.Amqp
  Installed Acme.Bowire.Protocol.Amqp 1.2.0 (4 file(s))

$ bowire plugin update                     # bump all
  Updating Acme.Bowire.Protocol.Amqp 1.2.0 -> 1.3.0...

$ bowire plugin inspect Acme.Bowire.Protocol.Amqp
  Load context
    name:        BowirePlugin:Acme.Bowire.Protocol.Amqp
    collectible: True
    assemblies:  4
      Acme.Bowire.Protocol.Amqp 1.3.0
      RabbitMQ.Client            7.0.0
      ...
  Bowire contract implementations
    IBowireProtocol  Acme.Bowire.Protocol.Amqp.AmqpProtocol
Per-plugin settings
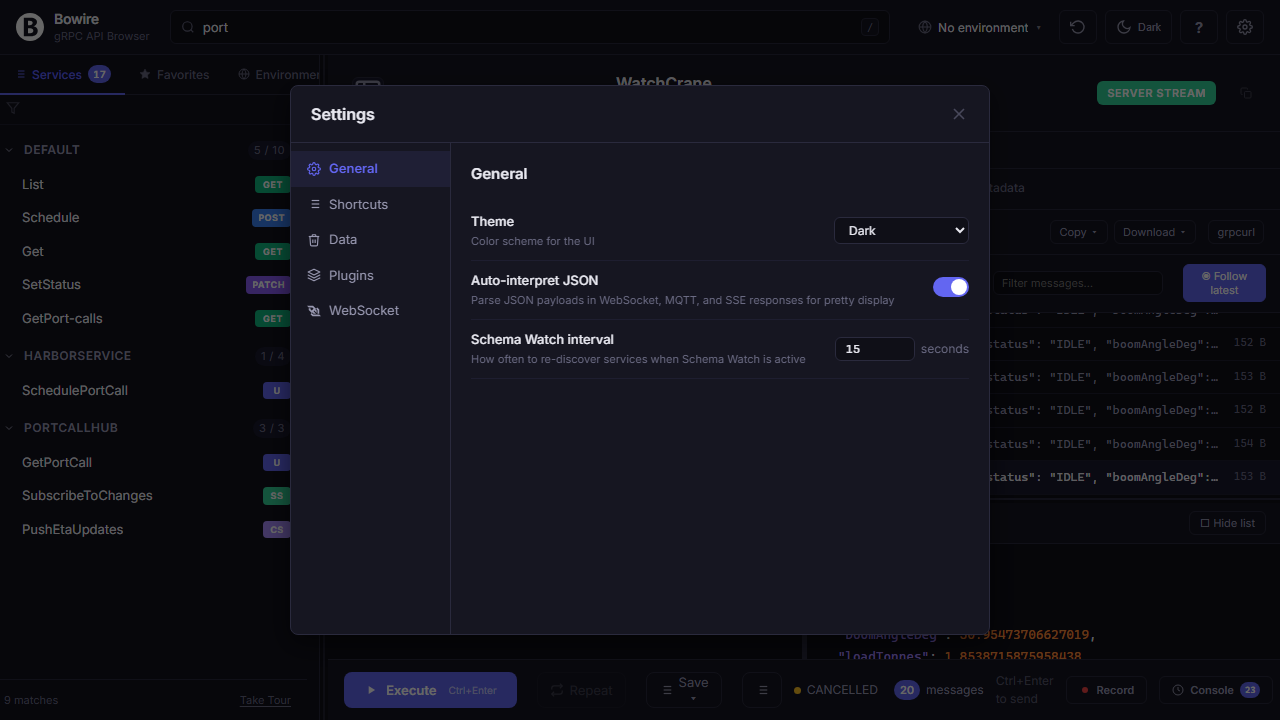
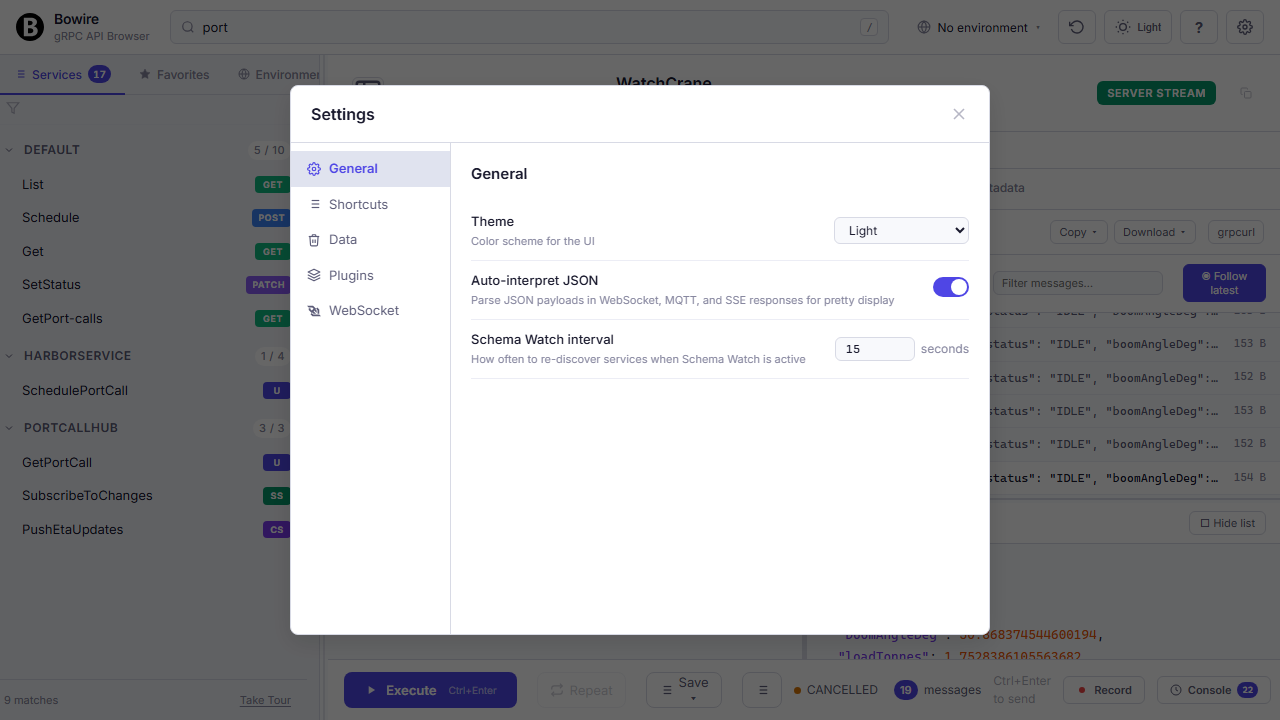
Every protocol plugin contributes its own settings section — granular control without leaving the UI.
General settings (theme, keyboard shortcuts), data management (where recordings, history, and environments live on disk), and a dedicated panel per installed protocol plugin. Each plugin implements its own BowirePluginSetting schema, so the UI always reflects exactly what that plugin supports — no hidden configuration in environment variables or JSON files.
One binary, three modes
Run as a .NET global tool and get three flavours of the same workbench — CLI subcommands for scripts, an HTTP-served UI for interactive use, and embedded middleware for teams that want the UI inside their own app.
bowire list <url> enumerates services, bowire describe <service.method> prints the full schema, bowire call <service.method> --body '{...}' invokes it — same output shape as the UI uses, so the CLI is scriptable against CI. Add --format json for machine-readable piping, or --recording to capture an output for later replay.
The standalone UI is just bowire --url https://api.example.com — the UI runs locally, hits the API with your auth, zero host-side changes. Plugin management (bowire plugin install / list / uninstall) shares the same state with the embedded mode.
$ bowire list --url https://api.example.com
WeatherService   gRPC
UserApi          REST
EventsHub        SignalR

$ bowire call UserApi.GetUser -d '{"id":42}'
{ "id": 42, "name": "Ada" }

$ bowire --url https://api.example.com  # opens UI
Intercepting proxy with HTTPS MITM
bowire proxy is a CA-trusted forward proxy that decrypts TLS on the fly, streams captured flows into the workbench, and converts any flow into a Bowire recording with one click.
Auto-generated CA on first run, leaf-cert minting per hostname, cache that survives restarts. Point your client (browser, mobile app under test, scripted runner) at localhost:8888, install the printed CA, every request flows through the proxy — HTTPS included, fully decrypted. The workbench Proxy view subscribes to the flow stream over SSE and renders each captured request/response live.
One-click "send to recording" converts a captured flow into a template that bowire scan, fuzz, or mock can replay. The CA lives at ~/.bowire/proxy-ca.{pfx,crt} — same place across restarts, importable into the trust store of any client you're driving.
$ bowire proxy --port 8888 --api-port 8889

   # proxy        listening on 0.0.0.0:8888
   # workbench    http://localhost:8889/proxy
   # CA exported  ~/.bowire/proxy-ca.crt

$ bowire proxy --export-ca ~/Downloads/bowire-ca.crt
JWT decode, tamper, re-sign
bowire jwt decode splits the header / payload / signature, validates exp / nbf / iat, lists the present claims. bowire jwt tamper probes the classic alg: none acceptance, signs with a chosen secret, lets you override individual claims for the smoke-test sequence.
Scriptable enough for CI gates and security-regression suites — same exit codes / SARIF output as the rest of the security CLI surface so a failed alg:none downgrade attempt or a successful claim-injection lands in the Code-Scanning dashboard next to a regular scan finding.
Pairs naturally with the workbench's auth helpers above: capture a JWT from a real session via bowire proxy, run bowire jwt tamper against it to probe the verification surface, then re-inject the tampered token into the next request with the auth-helper's override flag.
# Decode header + payload, flag well-known weaknesses
$ bowire jwt decode <token>

# alg:none downgrade (CVE-2015-9235 class)
$ bowire jwt tamper <token> --alg-none

# Inject a claim, re-sign with a weak secret
$ bowire jwt tamper <token> \
                   --set isAdmin=true \
                   --secret weak123
Into the engine room
That was the topside tour. For SDK generation, protocol-plugin authoring, and everything else that lives below the waterline — read the docs or dive into the source.
The engine room runs on hands. Join the crew →