Workflow · Backend developers
A debug UI inside your own app
You ship an ASP.NET service. Your team needs to poke at it — not through a separate Electron app behind a sign-up flow.
Two lines of code turn any WebApplication into a Bowire host. Every endpoint your service registers shows up in the sidebar, typed and invokable, without a schema file to maintain.
Wire it in
One NuGet install, one MapBowire(). Bowire reuses your app’s service provider and EndpointDataSource — nothing to configure twice.
Program.cs — that’s the whole setup
Add the package, register the services, map the endpoint. The browser UI mounts at /bowire and picks up every protocol plugin you have installed.
builder.Services.AddBowire();
builder.Services.AddBowire<BowireGrpcProtocol>();
builder.Services.AddBowire<BowireSignalRProtocol>();
// ...other plugins

var app = builder.Build();

app.MapBowire();
Hit https://localhost:5001/bowire and the sidebar already has your services in it. gRPC via Server Reflection, REST via your OpenAPI endpoint, SignalR hubs from the endpoint data source, GraphQL via introspection — all at once.
Every protocol, one sidebar
Your service probably speaks more than one protocol already. Bowire lists everything in a single tree — gRPC method next to SignalR hub next to REST endpoint.
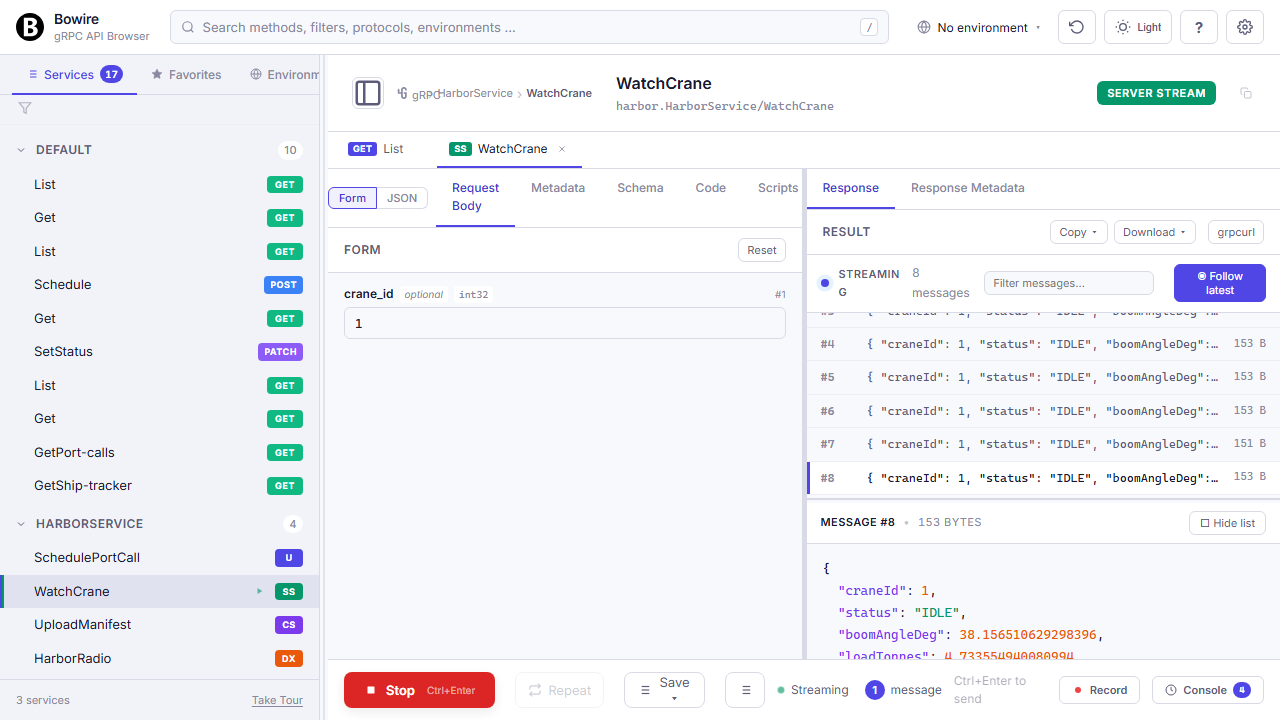
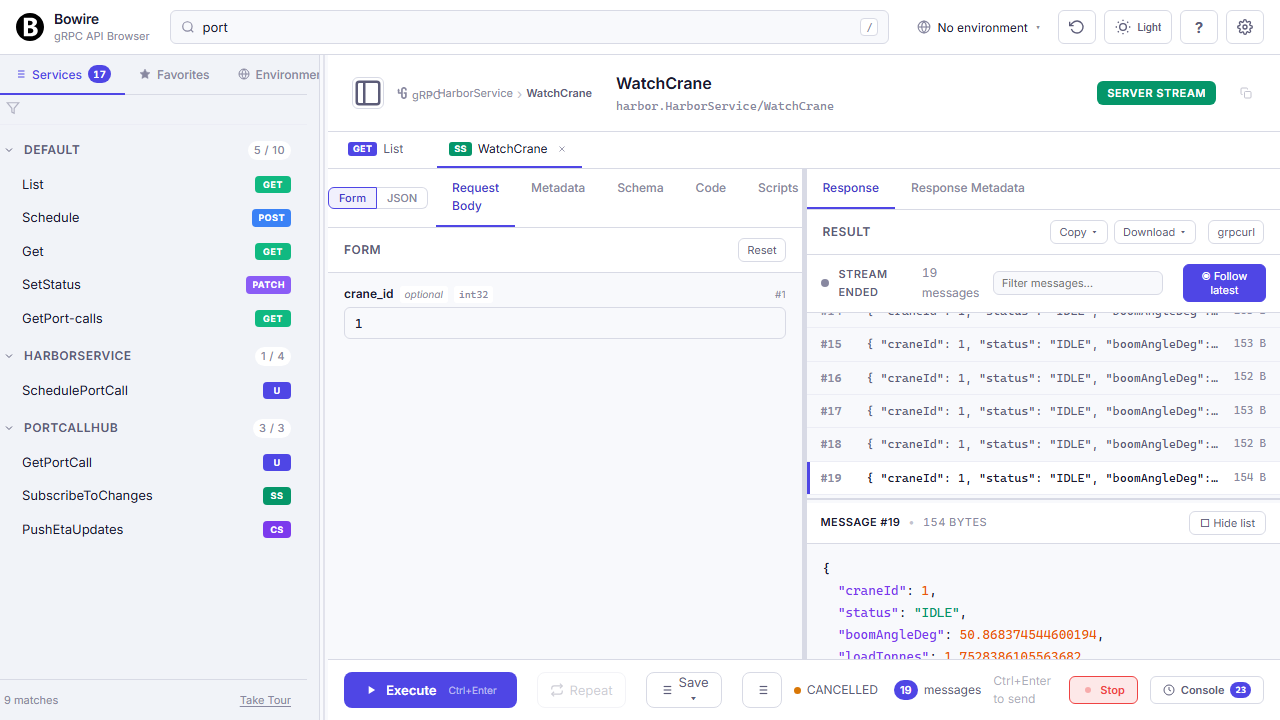
Streaming views, duplex channels, binary frames
Invoke any method, watch the response render in the right pane — or open a persistent channel for long-running duplex work.
gRPC server-stream, client-stream, and duplex show up as the same Wireshark-style message list. SignalR invokes render inline, streams open a duplex channel. Raw WebSocket? Text + binary frame editor. MQTT subscribe? Topic tree with QoS. You never leave the sidebar + response pane pattern — the UI adapts per protocol, not per tool.
All call types on the feature tour →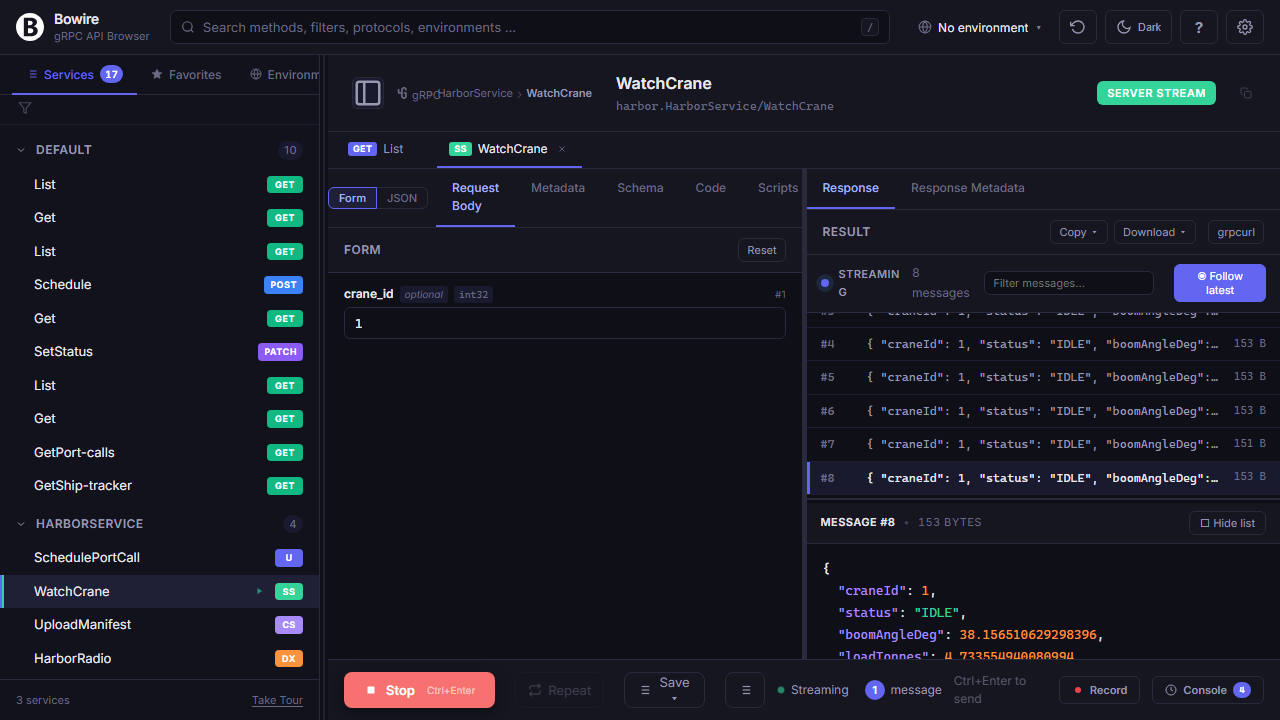
Hot reload — no restart after a route change
Add a new method to a service, save, re-run. The next discovery tick picks it up; you never hit refresh.
Bowire polls discovery every few seconds against every configured URL. A new gRPC method, a new SignalR hub handler, a new REST route — shows up within a tick without anyone disconnecting or re-uploading a schema. Cuts the inner dev loop from “change, rebuild, reconnect, click” down to “change, rebuild, click.”
No schema files to maintain — full writeup → Auto-discovery in detail →
sequenceDiagram
    autonumber
    participant Bowire
    participant gRPC as gRPC Reflection
    participant REST as OpenAPI doc
    participant Hub as EndpointDataSource
    participant UI as Workbench UI

    loop every few seconds
        Bowire->>gRPC: ListServices
        gRPC-->>Bowire: methods + descriptors
        Bowire->>REST: GET /swagger/v1/swagger.json
        REST-->>Bowire: paths + schemas
        Bowire->>Hub: enumerate hubs
        Hub-->>Bowire: hub + method list
        Bowire-->>UI: sidebar diff (+added · -removed · ~changed)
    end
Debug, measure, share
Inline auth, per-environment variables, perf smoke tests, recordings. Everything a backend dev needs to reproduce a bug or confirm a fix.
Record — send to the bug tracker as a repro
Click record, reproduce the bug, click stop. You have a file that replays the exact same calls against any environment.
Recordings capture request, response, status, timing, metadata across every protocol. Replay against another environment to check drift, or against a colleague’s laptop to confirm the fix landed. Convert the recording into test assertions for CI, or export as HAR to attach to a ticket.
Record & replay in detail →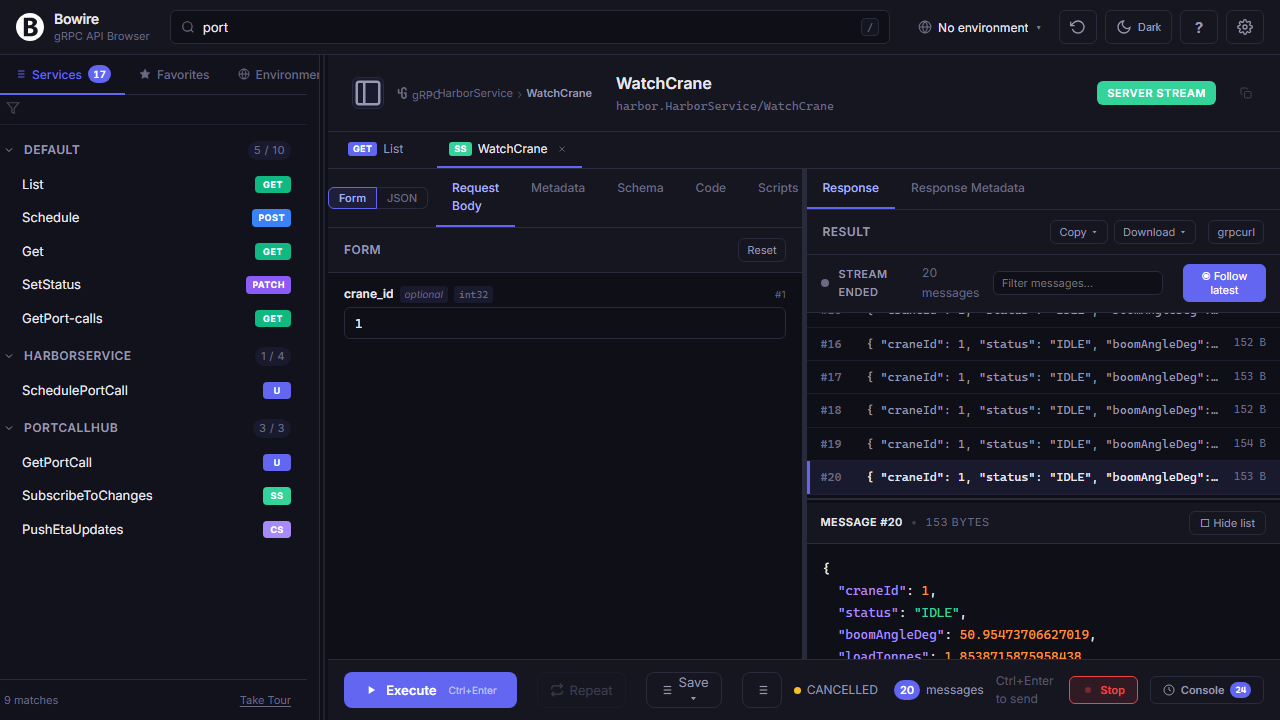
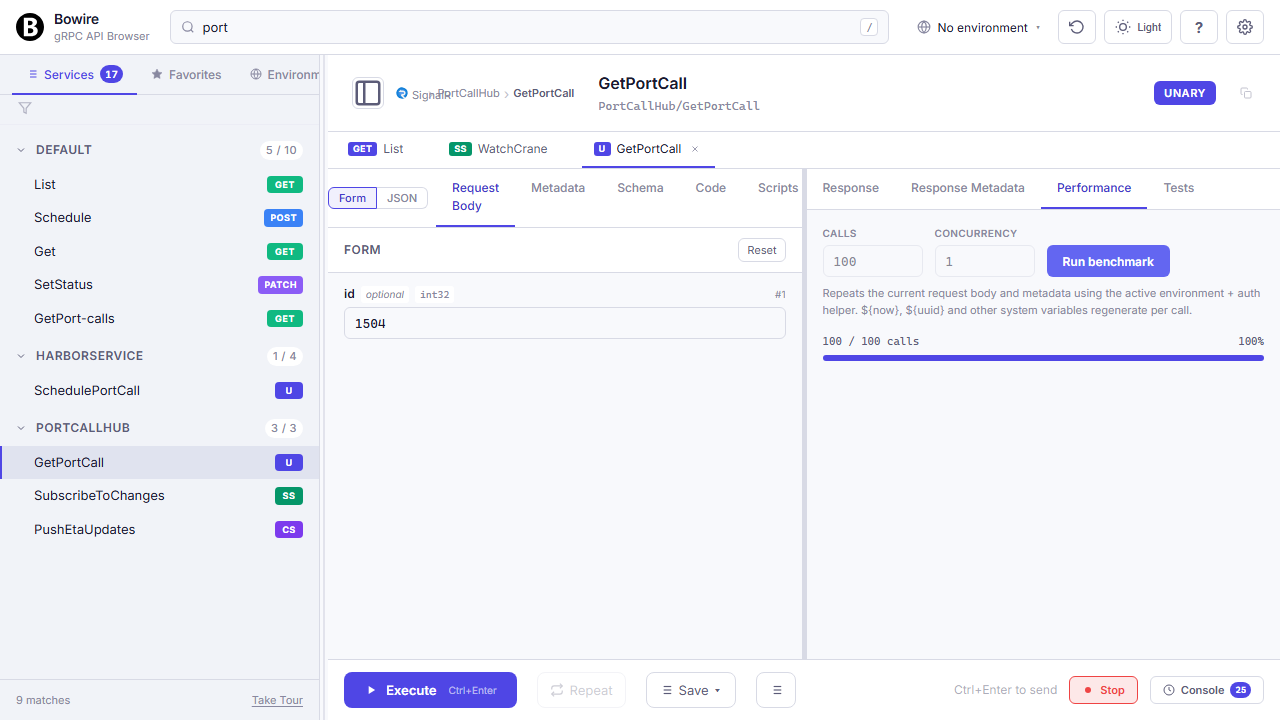
Performance smoke test, right in the pane
Repeat any call 500× and watch P50 / P90 / P99 render live. No k6 setup.
Exact-enough for “did my change regress this endpoint?” — not a replacement for proper load testing, but enough to spot a 10× slowdown before it hits staging. Export the call as k6 or vegeta when you do need a proper soak test.
Performance testing in detail →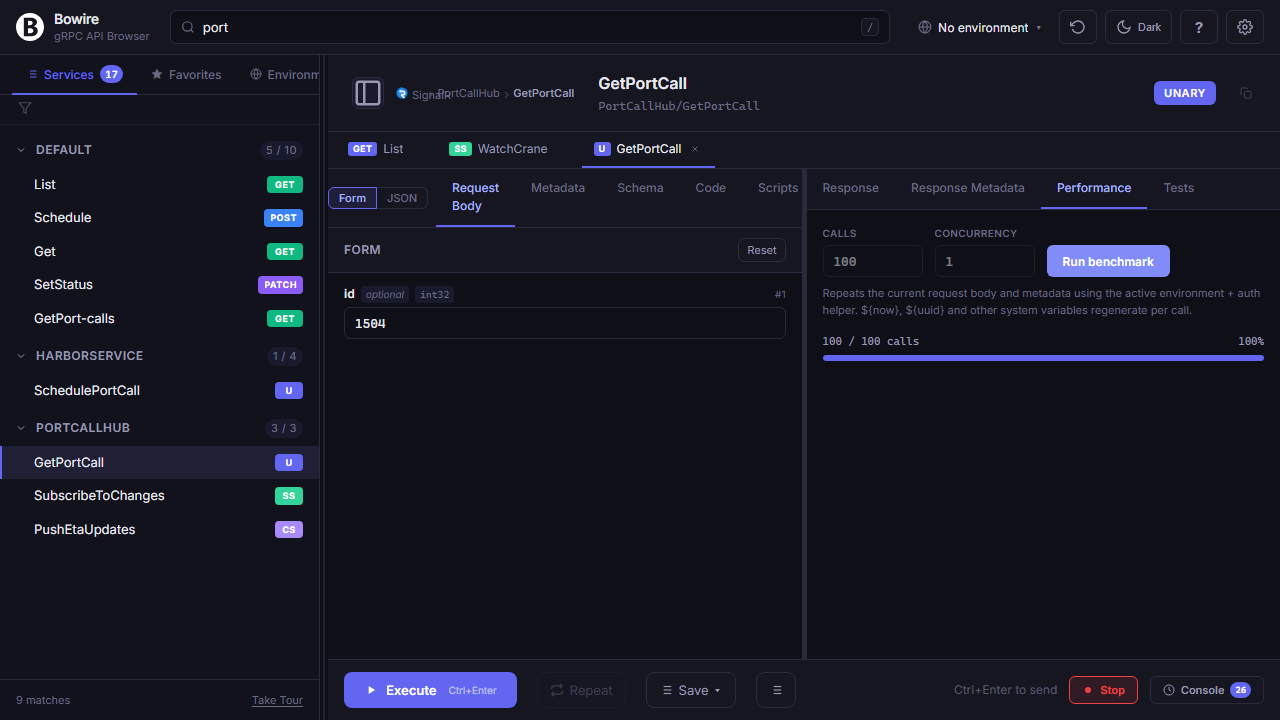
Ready to embed it?
Two-line setup, zero schema files, every protocol your service already speaks.